To make consistent big profits in the market, you have to master the Breakouts in chart patterns and here we are Revealing Secrets of the Trendline Break Strategy. Let’s deep dive into the different types of Breakout Patterns and multiple ways to detect them with accuracy.
1. Draw the Trend Line
When drawing the trend line on an uptrend, the first step is to draw a trend line right, obviously in an uptrend just like this you want to connect all the higher lows with your trend line. In the downtrend you have to connect all the lower highs with your trend line make sure you try to get as many touches as you can. For a trend line to be valid the price has to touch it at least three times it is not enough to draw a trend line if the price has only touched it two times remember the more times the price touches the trend line the stronger it is it’s just like your support and resistance. Refer the given chart pattern below.
2. Wait for the Trendline Break:
Now, the most important thing is to keep patience before taking trade. A trade on the market should not be placed immediately after the trend line is broken. When the trend line breaks, give time for the trade to set up. Most first-time traders tend to break this rule and lose money because of false breakouts. Too much optimism and hype at times, without proper market analysis can lead to disastrous outcomes. Always keep in mind that time is needed to confirm whether or not a move is legit. Refer the given chart pattern below.
3. Identify the Breakout Candle:
Mark the breakout candle to the trend line on the graph after the price has passed the predetermined range. Refer the given chart pattern below.
4. Enter and Exit Like a Pro:
Make sure to wait for the price retrace to the area breakout candle. When looking for signs of rejection, check long wicks on the candles in this box. This indicates price is having problems moving past this area. You should enter the trade once the rejection has been confirmed. Put your stop loss above the breakout candle in the down trend or below it in an uptrend. This gives you assurance that you will take minimized losses in case the market becomes unfavorable towards you.
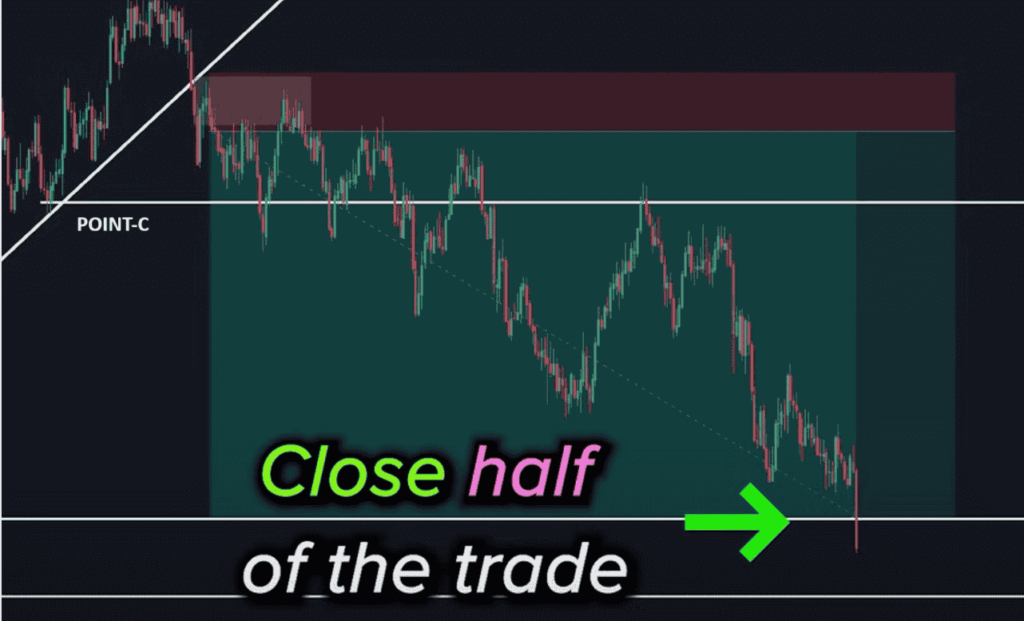
5. Set Targets For Taking Profit:
Zoom out of the chart and identify the areas where the price touched the trend line previously. Name these points (for example, Point A, B, C). For your first Take Profit (TP1), set it to Point C. If the price breaches Point C, then look to Point B (which is TP2), and so forth. This helps achieve profits in a gradual manner as the price shifts towards your favor.
6. Managing Your Trade:
You can take partial profit towards TP2 gradually, or if you see fit, take all of it at TP1. If the breakout of TP2 happens, you might want to look out for Point A as the next target. It works as long as you cut along the way in order to maximize the profits while benefiting from the predetermined secured profits.

Before knowing the secrets of Trendline break you can master the candle stick chart analysis: Click here.
Revealing Secrets of the Trendline Break Strategy: Examples of Different Trends
Example in an Uptrend:
- Draw the Trend Line: Connect the higher lows to draw the trend line. Ensure the trend line has at least three touches to confirm its validity.
- Wait for the Trendline Break: Monitor the price action and wait for the price to break the trend line.
- Identify the Breakout Candle: Once the price breaks, use a rectangle tool to highlight the breakout candle. Extend the box to the right.
- Enter and Exit Like a Pro: Wait for the price to retrace to the breakout candle’s area. Look for long wicks or other signs of rejection. Enter a sell trade once you see rejection. Place your stop loss above the breakout candle.
- Set Take Profit Levels: Set your first take profit at the next significant level where the price previously bounced (Point C). If the price breaks this level, aim for the next point (Point B).
Example in a Downtrend:
- Draw the Trend Line: Connect the lower highs to draw the trend line. Ensure the trend line has at least three touches to confirm its validity.
- Wait for the Trendline Break: Monitor the price action and wait for the price to break the trend line.
- Identify the Breakout Candle: Once the price breaks, use a rectangle tool to highlight the breakout candle. Extend the box to the right.
- Enter and Exit Like a Pro: Wait for the price to retrace to the breakout candle’s area. Look for long wicks or other signs of rejection. Enter a buy trade once you see rejection. Place your stop loss below the breakout candle.
- Set Take Profit Levels: Set your first take profit at the next significant level where the price previously bounced (Point C). If the price breaks this level, aim for the next point (Point B).

Download the pdf of all Candlestick chart patterns.
Important Tips about Trendline Break Strategy:
- The trendline strategy works best with at least three touches. This confirms the strength of the trend line.
- Be patient and wait for confirmations. Impulsively entering trades can lead to losses.
- Adjust the strategy according to your preferred time frame (e.g., 15-minute, 1-hour, 4-hour). This strategy is flexible and works across different time frames.
- Always manage your risk with appropriate stop losses and take profits. Risk management is crucial to long-term trading success.
Continuing the Trendline Break Strategy:
Entering the Trade:
- At this point, we enter our buy position when we see several candles with long wicks, indicating rejection of the strong area and a likely move up.
- Place your stop-loss below the rectangle area and the candlestick that broke the trend line.
- For a more precise entry, you can enter when a Doji candlestick forms, indicating a loss of momentum in the retracement.
An entry can be a bit more conservative when a Doji candle is formed as retracement is losing momentum.
Taking Profit:
The first take profit (TP1) is at the first scenario significant level where the price bounced beforehand.
After hitting TP1 lock profits by moving your stop-loss to the top for TP2.
Don’t forget that there is no confirmation that the price will reach all- the- way high. So be prepared to respond and get out of the trade if price appears to reverse.
Adjusting Stop-Loss:
As the price makes new higher highs and higher lows, adjust your stop-loss to the last higher low.
That way, even if the price goes against you, you still make some profit.
Dealing with Losses:
At times, the strategy will fail, and you will get stopped out. This is a reality of trading.
You need to adjust to the market and be ready to exit when a market reversal is possible.
Additional Example:
- Wait for a break of the trend line by the price in an uptrend and draw your trend line.
- In an uptrend, draw your trend line and wait for the price to break it.
- Highlight the breakout candle with a rectangle and wait for the price to retest this area.
- Enter the trade once you see rejection signals. Place your stop-loss above the breakout candle.
- Set your take profit levels at previous touch points.
Conclusion:
- The trendline strategy is effective, but it’s essential to be patient and wait for confirmations.
- Use this strategy on your preferred time frames, like 15-minute, 1-hour, or 4-hour chart.
- For Intraday Traders time frame can be 5 minutes, 15 minutes, or 30 minutes. Similarly, for Swing traders, it may vary from 1 hour to 1 day time frame.
By following these expanded steps and being disciplined, you can improve your trading performance and achieve better results. Remember, always adapt to the market and manage your risk wisely. Happy trading!
Know how to choose multi-bagger stocks capable of making investments 100 time.
Pingback: 5 Important Parameters to Know the Market Movement Apart from Chart Patterns stockmarketpatterns.com