Lets discuss about 5 Important Neutral Chart Patterns that could assure a Trader to buy or sell from Top or Bottom.
Table of Contents
Rising Channel Pattern: one of the 5 Important Neutral Chart Patterns
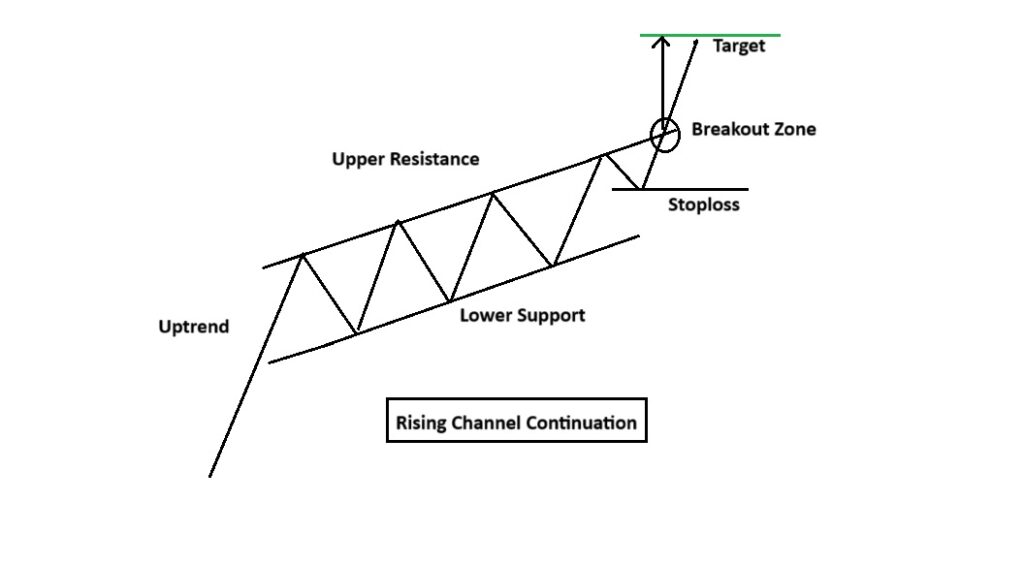
The Rising Channel Pattern is the combination of two upward-sloping parallel trend lines that act as support and resistance. The pattern occurs in an uptrend and is characterized by higher highs and higher lows.
It may act as a continuation pattern if the price breaks the Resistance and acts as a reversal pattern if the price breaks the support.
This pattern indicates that despite the price rise, a price hustle is going on between the buyers and sellers and later on one of them wins the battle, depending on the placement of the pattern breakout.
On the next article, I have discussed how the pattern works as a continuation and reversal pattern.
In this kind of pattern formation, traders take trading discission based on the placement of the breakout that is, if the price breaks the resistance on the upside then a continuation of long upside breakout is possible. Likewise, if the price breaks the support on the downside then a short trade is initiated (reversal of existing uptrend).
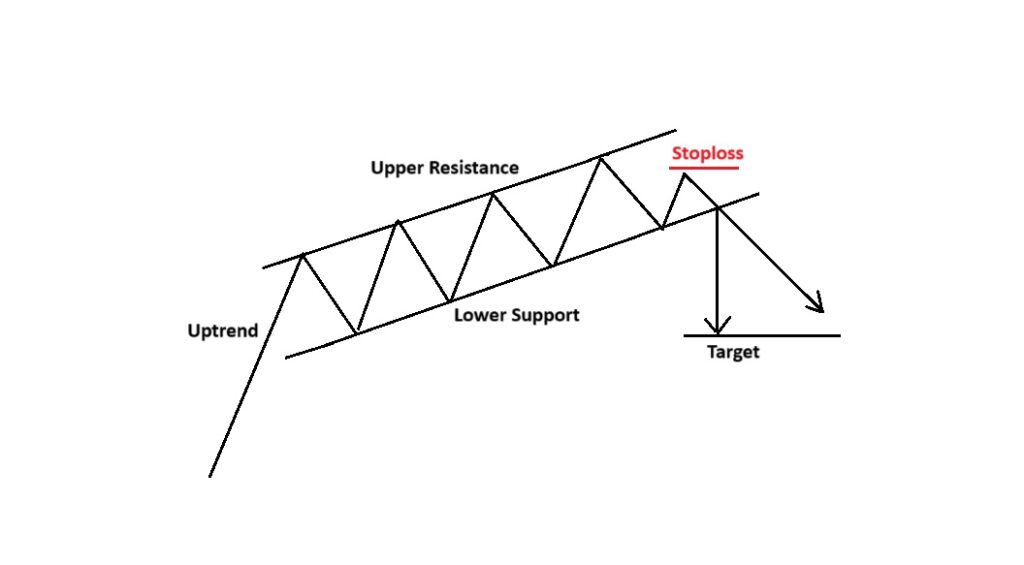
The possible target for the pattern is normally calculated by measuring the height of the channel that is, vertical distance between the two parallel trend lines above or below the breakout point. Depending on the placement of the breakout.
Where to put stoploss, that depends on the carryout of the breakout, that means, if the price breaks the resistance on the upside, then you can put stop loss just below the upper resistance, and if the price breaks the support on the downside, then you can put the stoploss just above the lower support.
The Rising Channel Pattern is considered to be more accurate, when price breaks Support or Resistance with a significant rise in the volume.
Learn about 6 important Continuation patterns to boost Advanced technical analysis.
Falling Channel Pattern:
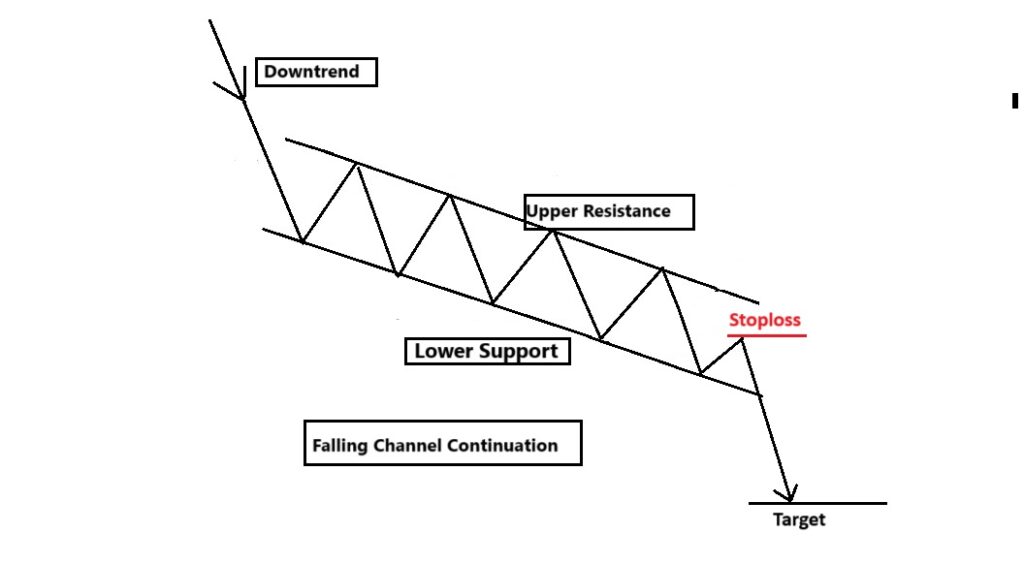
The falling Channel Pattern formed by two downward-sloping parallel trend lines those acts as support and resistance.
The pattern that appears in a downtrend and is distinguished by lower highs and lower lows.
It acts as a continuation pattern until the price breaks the support and acts as a reversal pattern when the price breaks the upside.
This pattern indicates that despite the price fall, a tug of war happens between the sellers and buyers. Later on one of them wins the war, which decides the breakout point.
Below You can see how the pattern works as a continuation and reversal pattern.
Falling Channel Reversal chart pattern
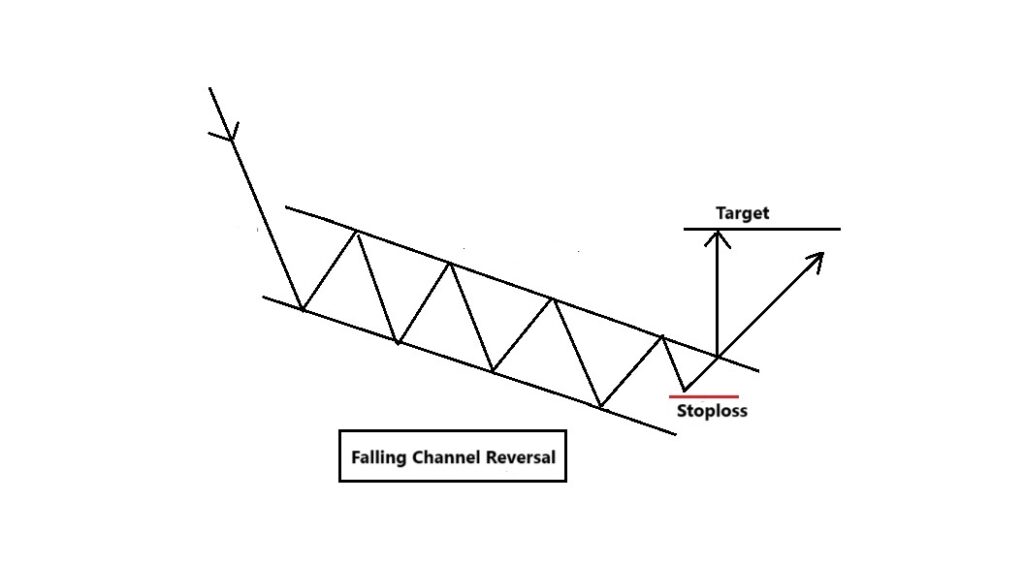
This is a type of pattern, where traders carry out their trade depending on the placement of the breakout. That means, suppose the price breaks the resistance on the upside then a bull run is possible (reversal of existing downtrend). Similarly, when the price breaks the support on the downside then a short trade is possible which leads to continuation of existing downtrend.
The possible target for this pattern is normally calculated by measuring the height of the channel that means, vertical distance between the two parallel trend lines above or below the breakout point, depending on the placement of the breakout.
Where to put the stop loss that depends on the placement of the breakout that is, when the price is breaking the resistance on the upper side then stop loss is kept just below the upper resistance. In other way, when the price breaks the support on downside then the stop loss is placed just above the lower support.
This Falling Channel Reversal chart pattern is considered to be more accurate, if the price breaks support or resistance with a potential rise in volume.
Download all candlestick chart patterns pdf here
Rising Wedge Chart Pattern

The Rising Wedge pattern is a bearish candlestick pattern that begins widely and continuously contracts as the price moves higher and the forming a narrow trading range.
This pattern is a combination two converging lines. That is, an upper resistance line and a lower support line, in such a way that the slope of the wedge will be in an upward direction. These two converging lines indicates that bullishness within the pattern is getting diminished slowly.
It behaves as a continuation pattern, if it appears during a downtrend and as well as it acts as a reversal pattern if it appears during an uptrend. In both of the cases, for the case of a Rising wedge pattern, the price is observed as breaking the lower support line on the downside.
This pattern signifies that despite the price rise inside the wedge, a tug of war is going on between the buyers and sellers and later on the sellers take over the battle.
Below, you can see how the pattern works as a continuation and reversal pattern.
Rising Wedge Reversal Pattern
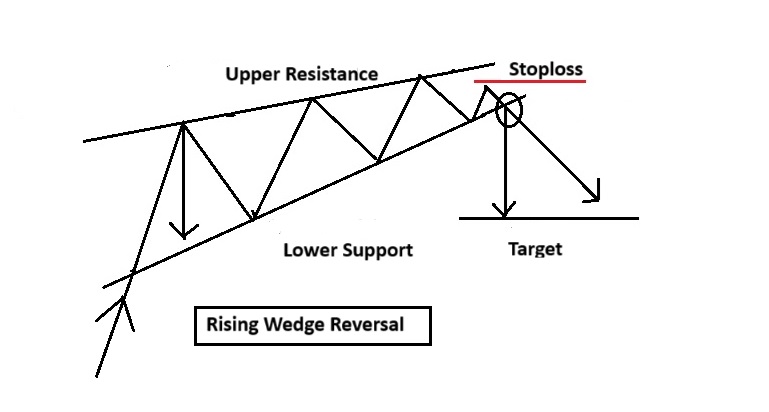
The pattern formation only can be confirmed, when the lower support line price been broken on the downside. This is the right time when a trader can take a short entry in the Stock.
The pattern is considered to be more accurate if the price breaks above the upper resistance line with a significant rise in volume.
In the case of this pattern, there is no target predicting technique, and hence, it is advised to use a trailing stop loss in case of this pattern or other aspects of technical analysis to forecast price targets.
In this pattern, the stop loss is placed just below the upper resistance, as shown in the figure on the previous page.
Download HAMMER Candlestick chart pattern pdf and master yourself how to buy from Bottom
Falling Wedge Chart pattern
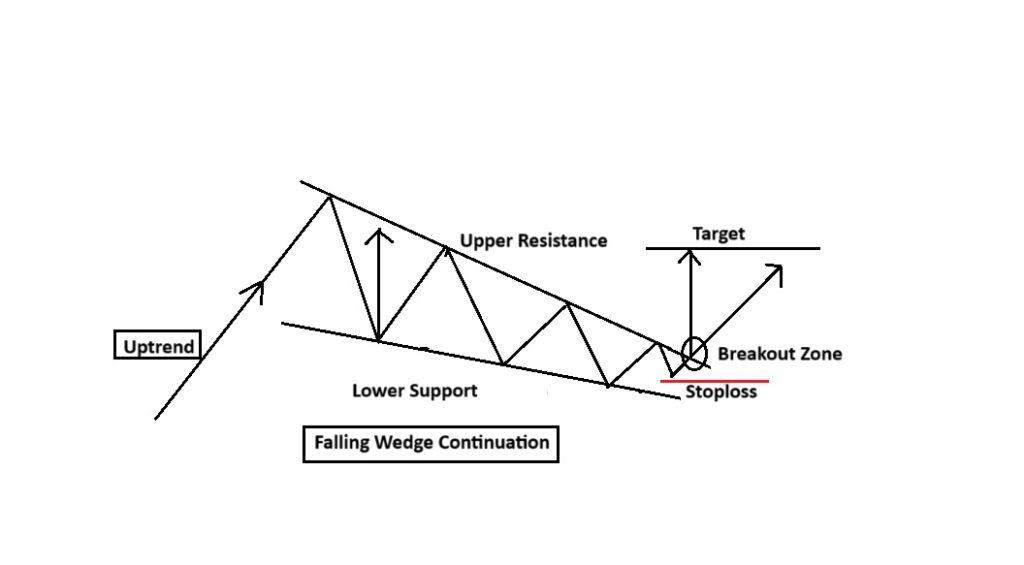
Falling Wedge is a bullish pattern that begins wide and contracts as the price moves lower and the trading range becomes narrow.
When two converging lines that is an upper resistance line and a lower support line approach together such a way the slope of the wedge will be in downward direction. Both of these converging lines indicates that the bearishness is diminishing slowly.
It converts into a continuation pattern, if this pattern forms during an uptrend. Similarly, behaves as a reversal pattern if it forms during a downtrend. In two of the cases of falling wedge pattern, the price is seen breaking the upper resistance line on the upside making it a bullish.
This pattern indicates that despite the fall in price inside the wedge, a tug of war is going on between the sellers and buyers and eventually the buyers win the battle.
The pattern is most accurate, the price breaks above the upper resistance line with a significant rise in volume.
In Falling wedge pattern case, there is no target projecting technique and hence it is advised to use a trailing stop loss. At some instances, stop loss can be placed just below the upper resistance as shown in the figure.
Symmetrical Triangle chart pattern
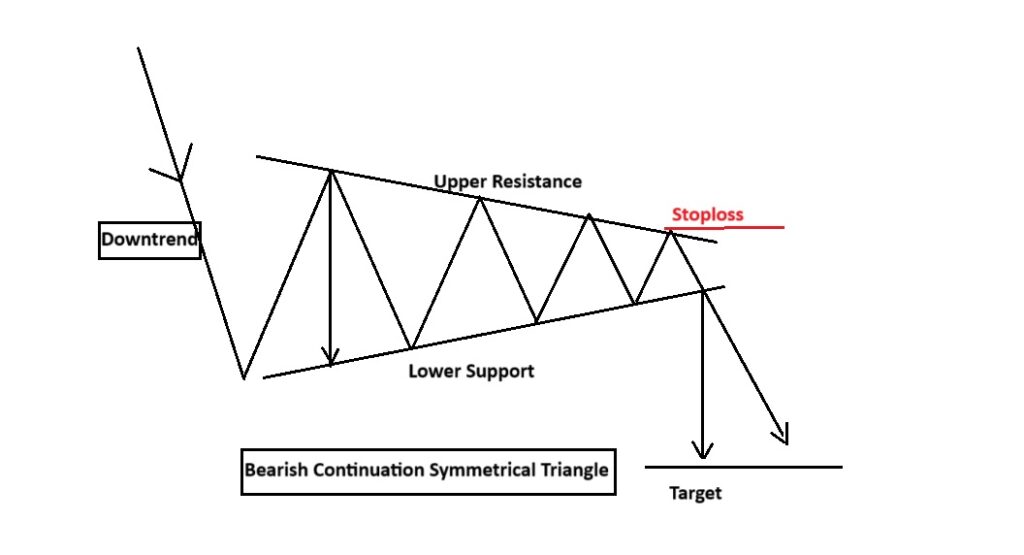
When two trend lines that are symmetrical in relation to the horizontal line try to converge at a direction, that comprise to form a symmetrical triangle pattern.
The pattern may be either be a continuation pattern or a reversal pattern, all depends on the upcoming trend and the creation of a breakout.
This pattern is characterized by a falling trend line or resistance line and a rising trend line or a support line, which converge at a point. Resulting the formation of a pattern that contains least two higher lows and two lower highs.
Symmetrical Triangle as a Continuation Pattern
If the pattern is broken towards the upside during an bullish run, then it is known as a Bullish Continuation Symmetrical Triangle. Likewise, if the pattern is broken downside during a Bearish trend, then it is known as a Bearish
Continuation Symmetrical Triangle.
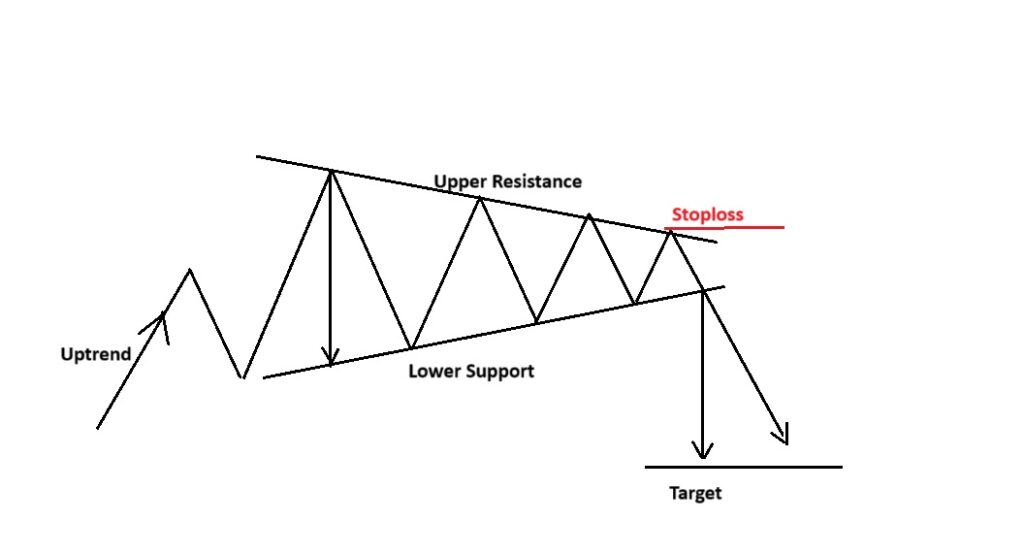
In the Symmetrical Triangle Pattern case, traders carry out their trade depending on the placement of the breakout, that is, if the price breaks the resistance on the upside, then a long trade is initiated. If the price breaks the support on the downside, then a short trade is initiated.
The potential target for the pattern is normally calculated by projecting the height of the symmetrical triangle at its thickest point above or below the breakout point, depending on the placement of the breakout. Depending on the placement of the breakout, the stop loss will be placed below or above the breakout zone. If the breakout happens towards the upside, then the stop loss will be just below the breakout, and if the breakout happens towards the downside, then the stop loss will be just above the breakout, as shown in the images on the previous page. The pattern is considered to be more reliable if there is a significant rise in volume when a breakout occurs.
The Bottom Line:
So, here you got to know 5 Important Neutral Chart Patterns, and never forget to look at the volume activity to confirm whether the breakout is real or fake. Real breakout is always associated with increased volume at the breakout zone. I would request everyone to spend a decent amount of time spotting all these patterns on charts and practice as much as they can to become good at reading these chart patterns.

