There are n-number of chart patterns created in the Candlestick, but as a stock market expert Your job is to master 6 important Reversal Chart Patterns. Here, all six chart patterns were clearly explained with examples.
Important Reversal Chart Patterns:
- 1- Head and Shoulder pattern
- 2-Inverted Head and Shoulder pattern
- 3-Double Top Pattern
- 4-Double Bottom Pattern
- 5-Rounding Bottom pattern
- 6-Rounding Top Pattern
Head and Shoulder pattern
It is a popular, among the 6 Important Reversal Chart patterns and easy-to-spot and with most reliable trend reversal patterns.
It is a Bearish reversal Candlestick pattern that appears after a continuous uptrend and signifies a meaningful reversal on completion of the pattern. This pattern indicates that buyers have lost the battle and the price is likely to go down from here.
As seen in the chart below, this pattern is formed by three peaks, wherein 1st peak is known as the left shoulder, 2nd peak (highest one) is known as the head and the 3rd peak is known as the right shoulder. The line formed by connecting the bottom of the left and right shoulder is known as the neckline. The pattern is said to be complete only when the price breaks the neckline on the downside.
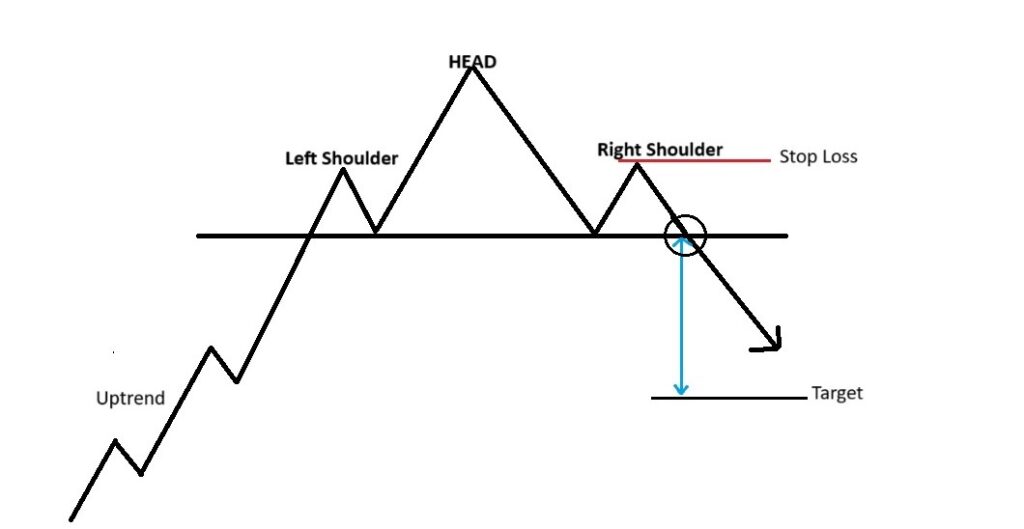
As seen in the chart above, after a long bullish trend, the price rises to a peak and subsequently declines to form a trough. The price rises again to form a second high substantially above the initial peak and declines again. The price rises again for the third time, but only to the level of the first peak, before declining again to the neckline.
Now, a short entry is taken once the price breaks the neckline on the downside.
The potential target for the pattern is normally calculated below the neckline equal to the price difference between the high point of the head and the neckline.
Stop loss will be placed at the edge of the right shoulder as shown in the figure on the previous page.
The pattern is considered to be more reliable if there is a significant rise in volume when the price breaks below the neckline.
Inverted Head and Shoulder Chart Pattern
As the name indicates, it is an inverted version of the head and shoulder pattern explained above.
It is a Bullish reversal candlestick pattern that appears after a defined downtrend and signifies a meaningful reversal on completion of the pattern. This pattern shows that sellers have lost the battle and the price is likely to go up from hereon.
As seen in the chart below, this pattern is formed by three lows, wherein 1st low is known as the left shoulder, 2nd low (lowest one) is known as the head and the 3rd low is known as the right shoulder. The line formed by connecting the top of the left and right shoulder is known as the neckline. The pattern is said to be complete only when the price breaks the neckline on the upside.
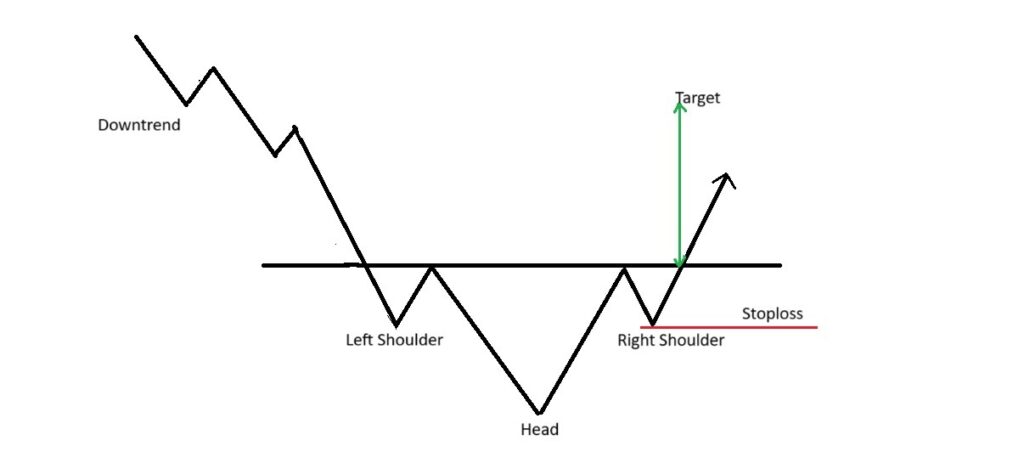
As seen in the chart above, after a long bearish trend, the price falls to a trough and subsequently rises to form a peak. The price falls again to form a second low substantially below the initial low and rises again. The price falls again for the third time, but only to the level of the first low, before rising again to the neckline.
Now, a long entry is taken once the price breaks the neckline on the upside.
The potential target for the pattern is normally calculated above the neckline equal to the price difference between the low point of the head and the neckline.
Stop loss will be placed at the edge of the right shoulder as shown in the figure above.
The pattern is considered to be more reliable if there is a significant rise in volume when the price breaks above the neckline.
Double Top Chart Pattern
It is a bearish reversal pattern that appears after a defined uptrend and signifies a meaningful reversal on completion of the pattern.
This pattern is easy to spot on charts. It resembles with English letter ‘M’. This pattern shows that buyers have lost the battle and the price is likely to go down from hereon.
As seen in the chart below, this pattern is formed by two consecutive tops and a moderate decline between the two tops. The horizontal line drawn at the bottom formed between the two tops is known as the neckline. The pattern is said to be complete only when the price breaks the neckline on the downside.
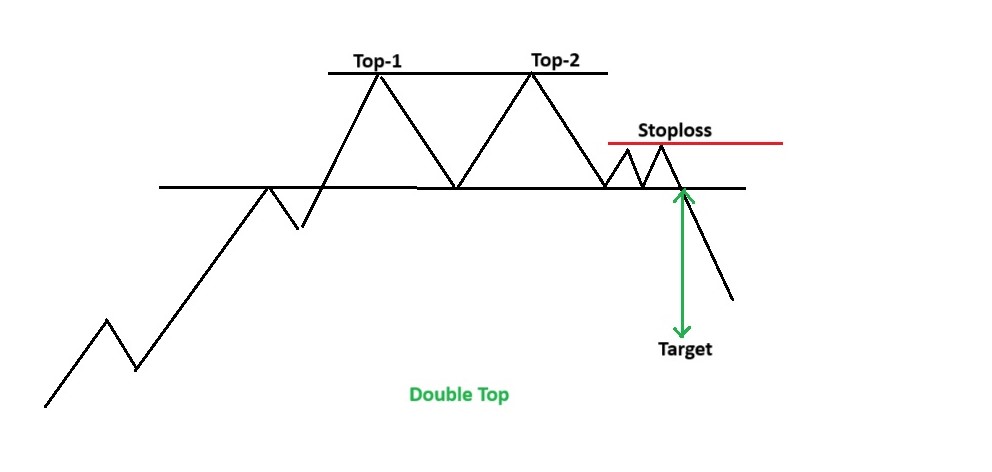
As seen in the chart above, after a long bullish trend, the price rises to form a top and then retraces back to some extent to form a bottom. The price rises again to form a second top which is almost equal to the first top, before declining again to the neckline.
Now, a short entry is taken once the price breaks the neckline on the downside.
The potential target for the pattern is normally calculated below the neckline equal to the price difference between the high point of the double top and the neckline.
Before the pattern neckline gets breached we normally see some consolidation happening before the breakout which will form a minor swing high and it will become the stop loss area for the pattern. The right placement of stop loss will give us a favorable risk and reward ratio.
The pattern is considered to be more reliable if there is a significant rise in volume when the price breaks below the neckline.
Double Bottom Chart Pattern
It is a bullish reversal pattern that appears after a defined downtrend and signifies a meaningful reversal on completion of the pattern.
This pattern is easy to spot on charts. It resembles with English letter ‘W’. This pattern shows that sellers have lost the battle and the price is likely to go up from hereon.
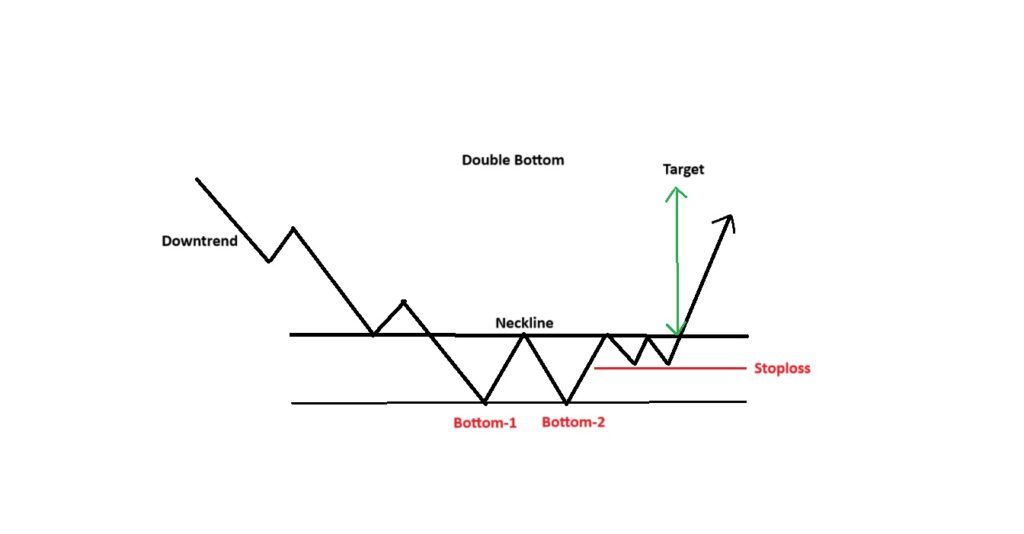
As seen in the chart above, this pattern is formed by two consecutive bottoms and a moderate rise between the two bottoms. The horizontal line drawn at the peak formed between the two bottoms is known as the neckline. The pattern is said to be complete only when the price breaks the neckline on the upside.
After a long bearish trend, the price falls to form a bottom and then retraces back to some extent to form a top. The price falls again to form a second bottom which is almost equal to the first bottom, before rising again to the neckline.
Now, a long entry is taken once the price breaks the neckline on the upside.
The potential target for the pattern is normally calculated above the neckline equal to the price difference between the low point of the double bottom and the neckline.
Before the pattern neckline gets breached we normally see some consolidation happening before the breakout which will form a minor swing low and it will become the stop loss area for the pattern.
The pattern is considered to be more reliable if there is a significant rise in volume when the price breaks above the neckline.
Rounding Bottom Chart Pattern
It is a long-term bullish reversal pattern that appears after a defined downtrend and a long period of consolidation and signifies a meaningful reversal on completion of the pattern.
This pattern is easy to spot on charts. Because its appearance is similar to the bottom of a bowl or a saucer, the pattern is also known as a saucer bottom pattern.
This pattern shows that after a period of consolidation, sellers have lost the battle and price is likely to go up from hereon. As seen in the chart above, this pattern is formed during a period of consolidation after a downtrend. During this period the fall in price is slowly arrested, a bottom is formed and then price slowly starts rising.
The horizontal line drawn across the top of the bearish and bullish sides of the rounding bottom pattern is known as the neckline. The pattern is said to be complete only when the price breaks the neckline on the upside.
Now, a long entry is taken once the price breaks the neckline on the upside.
The potential target for the pattern is normally calculated above the neckline equal to the price difference between the low point of the rounding bottom and the neckline.
In case of this pattern, the stop loss will be placed at the swing low which occurs before the price breaks the neckline on the upside as shown in the figure on the previous page. This will give us a favorable risk to reward ratio.
The pattern is considered to be more reliable if you notice high volumes during the downtrend followed by flat or low volumes during the consolidation period and again increased volume when price breaks above the neckline.
This pattern is generally considered a long term pattern and hence it gives a clear signal when formed on weekly or monthly charts.
Rounding Top Chart Pattern
It is a long-term bearish reversal pattern that appears after a defined uptrend and a long period of consolidation and signifies a meaningful reversal on completion of the pattern.
This pattern is easy to spot on charts. It looks completely opposite to the rounding bottom pattern and is also known as an inverted saucer bottom pattern. This pattern shows that after a period of consolidation, buyers have lost the battle and price is likely to go down from hereon.
As seen in the chart on the next page, this pattern is formed during a period of consolidation after an uptrend. During this period the price rise is slowly arrested, a top is formed
and then the price slowly starts falling. The horizontal line drawn across the bottom of the bearish and bullish sides of the rounding top pattern is known as the neckline. The pattern is said to be complete only when the price breaks the neckline on the downside.
Now, a short entry is taken once the price breaks the neckline on the downside.
The potential target for the pattern is normally calculated below the neckline equal to the price difference between the high point of the rounding top and the neckline.
In case of this pattern, the stop loss will be placed at the swing high which occurs before the price breaks the neckline on the downside as shown in the figure on the previous page. This will give us a favorable risk to reward ratio.
The pattern is considered to be more reliable if you notice high volumes during the uptrend followed by flat or low volumes during the consolidation period and again increased volume when price breaks below the neckline.
This pattern is generally considered a long term pattern and hence it gives a clear signal when formed on weekly or monthly charts.

Pingback: 6 Important Continuation Chart Patterns - stockmarketpatterns.com
Pingback: 5 Important Neutral Chart Patterns - stockmarketpatterns.com