A Candlestick pattern is the roadmap to predict the market’s further movement. In this all candlestick Chart patterns pdf, you will learn the different candles and their significance.
If you are about to start your trading journey then the first thing you need to learn is how to use candlestick charts. How to use this in Technical Analysis for trading or Investing.
A candlestick is a type of price chart used in technical analysis that displays the opening, high, low, and closing prices of a security for a specific period. Such a chart is visually very appealing and very informative. It indicates the current as well as the past behavior of market participants. Hence it is used by most of the traders across the world.
As shown in figure below a candlestick chart consists of a series of candles, with each candle representing the trading pattern of each trading period which can be a trading day, week or month, depending on the time frame of the chart.
Patterns formed by a single candle or grouping of two or more candles in a certain sequence are known as Candlestick Patterns. Such patterns help a trader to study the past and current price movement of the security to spot trend reversals or trend continuations and hence traders use these candlesticks patterns to identify trading opportunities.
Candlestick Patterns reflect what buyers and sellers are doing and hence it is important to study them.
Before we proceed further, first let us understand the basic candle formation.
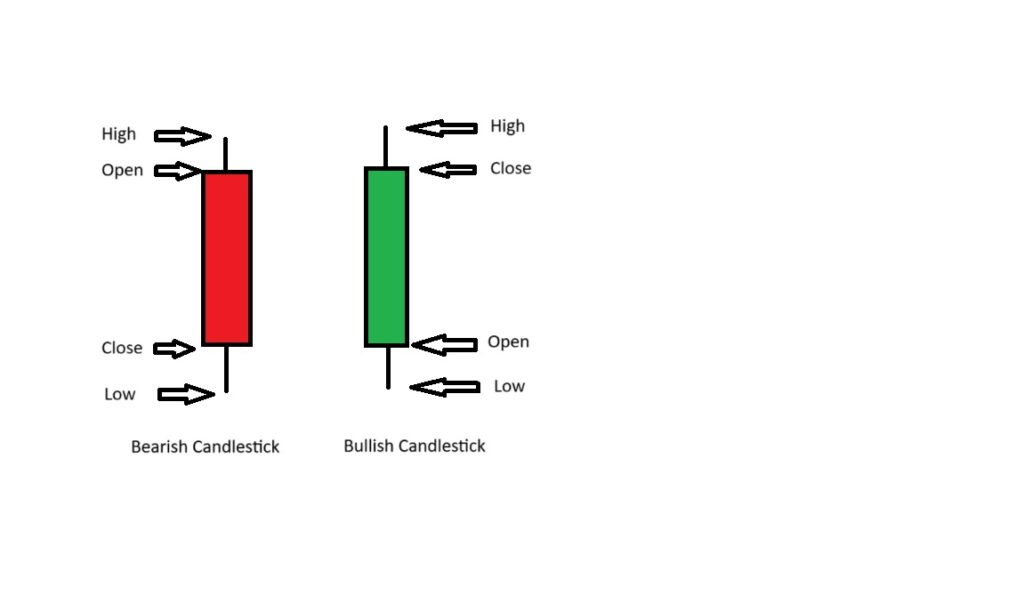
As shown in the figure above, a candle shows the high, low, open and close price of a security for a specific period.
Candles can be of two types – Bullish or Bearish.
Bullish Candle –When the close price is higher than the open price, then such a candle is known as a bullish candle. The central part of such a candle is filled with white or green. Such a candle signifies positive sentiment and indicates that the price of the security is likely to increase further as shown above image.
Bearish Candle –When the close price is lower than the open price, then such a candle is known as a bearish candle. The central part of such a candle is filled with black or red colour. Such a candle signifies negative sentiment and indicates that the price of the security is likely to decrease further.
There are different patterns of candlestick patterns form in the chart, like single/double/triple candlestick pattern. How these are deciding trend reversal
Upper Shadow: It is the vertical line between the high of the day and the close (for Bullish Candle) or the open (for Bearish Candle).
Single candlestick pattern: In this type a single candle formation in the chart decide the market trend. Lets discuss important single candles.
Body -It is the wide part of a candle, showing the difference between the open and closing price. If the open is below the close, then it is a bullish candle whose real body is filled with white or green colour and if the close is below the open, then it is a bearish candle whose real body in this case is filled with black or red colour.
Lower Shadow -It is the vertical line between the low of the day and the open (for Bullish Candle) or the close (for Bearish Candle).
This All candlestick chart Patterns pdf E-Book pdf is here
Click here to download the pdf.
Types of Candlestick Patterns:
Depending on the number of candles in the patterns, candlestick patterns can be divided into three types –
- Single Candlestick Patterns
- Two Candlestick Patterns
- Three Candlestick Patterns
There are many candlestick patterns, but here, I shall explain the most popular ones which give highly accurate results and are frequently seen on charts.
Single Candlestick Patterns –
As the name indicates, such patterns are formed by a single candle.
Popular Single Candlesticks Patterns include –
- Bullish Marubozu
- Bearish Marubozu
- Hammer Chart pattern
- Hanging Man Chart pattern
- Inverted Hammer Chart Pattern
- Shooting Star Chart Pattern
- Doji Chart pattern
Bullish Marubozu Chart Pattern
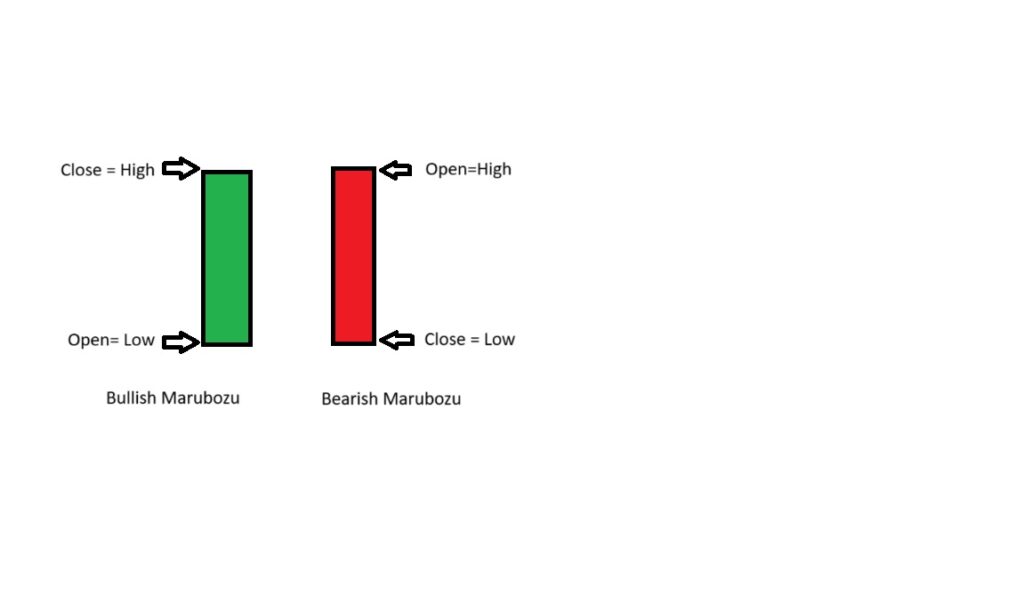
Bullish Marubozu is a single candlestick pattern that is used in technical analysis to predict bullishness.
The word Marubozu means “Bald” in the Japanese. Bullish Marubozu is basically a long green or white bullish candle that has no or negligible shadow (upper and or lower).
It occurs when the low is almost equal to the open and the high is almost equal to the close. It is considered to be a very strong sign of bullishness.
Hammer Chart Pattern
This candlestick pattern is formed by a candle that has a small body with a little or no upper shadow and a long lower shadow. It sis found at the bottom of a downtrend. It is a bullish reversal candlestick pattern.
Normally in case of this pattern, the lower shadow should be at least twice the size of the real body. The colour of the real body can be red or green. But hammer formed with green real body gives a stronger bullish signal.
This pattern act as a warning signal for a potential upside reversal.
Hanging Man Pattern
The candle exactly looks like a Hammer candle but it forms at top of the trend. Mostly the candle is same, only differs by the position where it formed. (Top/Bottom)
This candlestick pattern is formed by a candle that has a small body with a little or no upper shadow and a long lower shadow and is found at the top of an uptrend. It is a bearish reversal candlestick pattern.
Normally for this pattern, the lower shadow should be at least twice the size of the real body. The colour of the real body can be red or green. But hanging man formed with red real body gives a stronger bearish signal.
This pattern act as a warning signal for a potential downside reversal.
Inverted Hammer Chart Pattern:
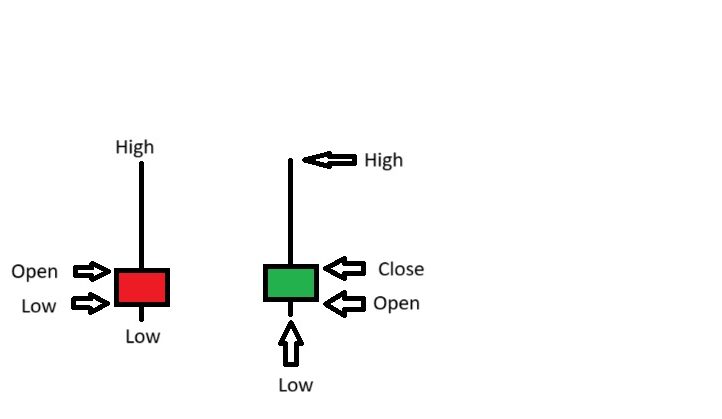
This pattern looks opposite of the hammer pattern. It is a bullish reversal candlestick pattern.
It is formed by a candle that has a small body with a little or no lower shadow and a long upper shadow and is found at the bottom of a downtrend.
Normally in case of this pattern, the upper shadow should be at least twice the size of the real body. The colour of the real body can be red or green. But inverted hammer formed with green real body gives a stronger bullish signal.
This pattern depicts that buyers are pushing the price higher and indicating trend reversal on the upside.
Shooting Star chart Pattern

This pattern looks opposite of the hanging man pattern. It is a bearish reversal candlestick pattern.
It is formed by a candle that has a small body with a little or no lower shadow and a long upper shadow and is found at the top of an uptrend.
Normally in case of this pattern, the upper shadow should be at least twice the size of the real body. The colour of the real body can be red or green. But shooting star formed with red real body gives a stronger bearish signal.
This pattern depicts that buyers are losing the ground and sellers are pushing the price lower indicating trend reversal towards the downside.
DOJI chart pattern
The classic definition of a doji intimates that the open price should be equal to the close price with ultimately making a nonexistent real body. The upper and lower wicks can be of any length just like Spinning top candlestick. However if open price and closing price if almost equal also with a thin body, the candle can be considered as a doji. Obviously the color of the candle does not matter. If anything matters is the fact that the open and close prices were very close to each other. Have a look at the chart below, where the doji’s appear in a downtrend indicating indecision in the market before the next big move.
Depending on the length of the shadows, doji patterns of 4 type’s – standard doji, long legged doji, dragonfly and gravestone doji.
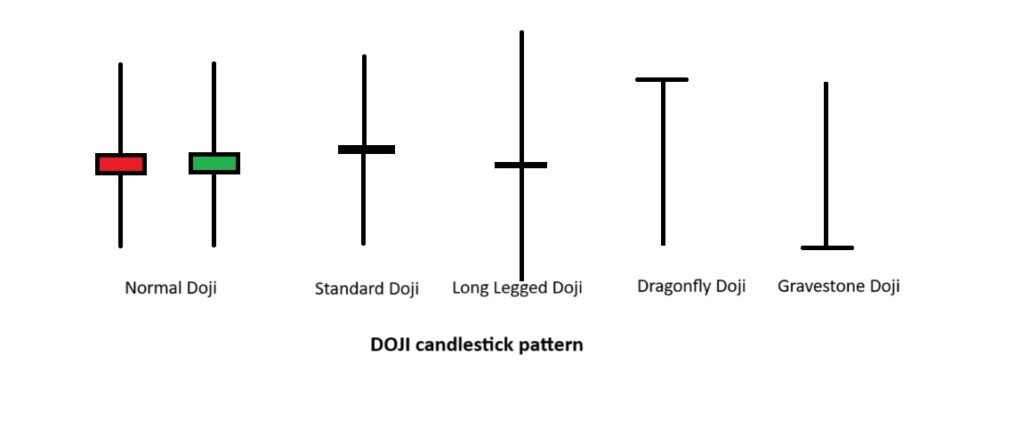
The each and every details about Doji candle is discussed in this article please go into it, https://stockmarketpatterns.com/doji-candlestick-pattern-pdf/
Two Candlestick Patterns
As the name indicates, Such patterns are formed by two candles. Some very important Two candlestick patterns are
- Bullish Engulfing Pattern
- Bullish Harami pattern
- Piercing Pattern
- Bearish Harami pattern
- Bearish Engulfing Pattern
- Dark Cloud Cover Pattern
Bullish Engulfing Pattern
A bullish engulfing pattern is a two-candle bullish reversal pattern that appears after a price decline. To identify it, look for the following characteristics:
The first candle closes bearishly, indicating continued selling pressure.
The second candle opens lower but then closes higher, completely covering the body of the first candle without considering the shadows.
This second candle closes bullish, signaling a strong shift in momentum from sellers to buyers.
So current pattern suggests that buyers have taken control, potentially leading to a price increase.
And this is what a bullish engulfing pattern means:
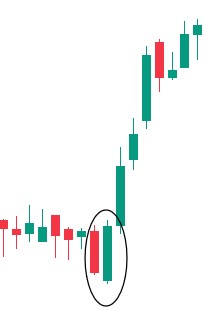
-In the first candle, sellers dominate, closing the price lower for the period. However, in the second candle, strong buying pressure emerges, closing above the previous candle’s high, indicating that buyers have taken control.
-At the end , a bullish engulfing pattern signifies that buyers have overpowered sellers and are now in control
Bullish Harami pattern
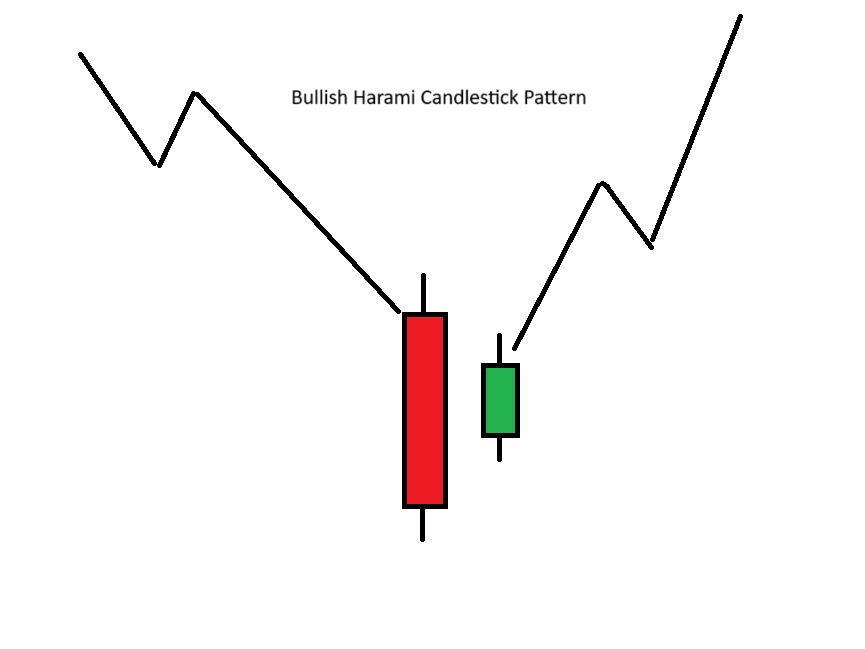
Bullish Harami is a two candle bullish reversal pattern that indicates end of the ongoing downtrend and start of an uptrend.
Pattern derives its name from the Japanese word Harami which means a “Pregnant Woman” because the graphic that represents this pattern resembles a pregnant woman.
In this pattern, the first day is generally a large red or black bearish candle that forms in line with the ongoing bearish trend, followed by a small green or white bullish candle having a small body and comparatively smaller lower and upper shadows.
The body of the second candle is contained within the body of the previous candle.
Ideally, the size of the body of the larger candle should be approximately 4 times the size of the body of the smaller candle.
The pattern works better if the upper and lower shadow of white or green candle doesn’t go beyond the black or red candle.
This pattern suggests that buyers are taking control and ready to take the price higher.
How a Bullish Harami Chart Pattern looks:
Piercing Candlestick pattern
The first candle closes bearishly, indicating continued selling pressure. where as the second candle opens lower, but strong buying pressure pushes the price up, closing beyond the halfway mark of the first candle’s body.
In essence, a piercing pattern suggests that buyers are starting to gain control, but the signal is not as strong as a bullish engulfing pattern.

On the first candle, the sellers are in control because they closed lower for the period.
Next, on the second candle, buying pressure has stepped in. and the close was bullish (more than half of the previous candle), which suggests you there is buying pressure present.
A bearish engulfing pattern is a (two-candle) bearish reversal pattern that forms after an advance in price. Here’s how to recognize it:
• The first candle has a bullish close.
• The body of the second candle completely “covers” the body first candle (without taking into consideration the shadow).
• The second candle closes bearish
And this is what a bearish engulfing pattern means:
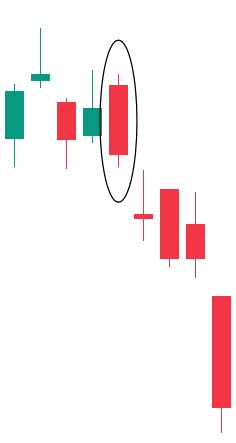
i. On the first candle, the buyers were in control since they closed higher for the period.
ii. On the second candle, strong selling pressure stepped in and the price closed below the previous candle’s low, which tells you that the sellers have won the battle for now. In essence, a bearish engulfing pattern tells you the sellers have overwhelmed the buyers and are now in control.
Bearish Engulfing Pattern
A bearish engulfing pattern is a (two-candle) bearish reversal pattern that forms after an advance in price. Here’s how to recognize it:
• The first candle has a bullish close.
• The body of the second candle completely “covers” the body first candle (without taking into consideration the shadow).
• The second candle closes bearish
And this is what a bearish engulfing pattern means:

i. On the first candle, the buyers were in control since they closed higher for the period.
ii. On the second candle, strong selling pressure stepped in and the price closed below the previous candle’s low, which tells you that the sellers have won the battle for now. In essence, a bearish engulfing pattern tells you the sellers have overwhelmed the buyers and are now in control.
Dark Cloud Cover Pattern
A dark cloud cover is a two-candle reversal pattern that forms after a surge in price. Unlike the bearish engulfing pattern that closes below the previous open, the dark cloud cover closes within the body of the previous candle. Thus, in terms of strength, dark cloud cover isn’t as strong as the bearish engulfing pattern.
Here’s how to recognize it:
• The first candle has a bullish close.
Bearish Engulfing Pattern, How to Master Candlestick Patterns Like a Pro?
• The body of the second candle closes beyond the halfway (More than 50%) mark of the first candle.
And this is what a dark cloud cover means:
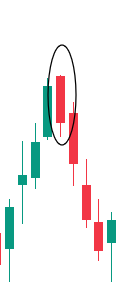
i. On the first candle, the buyers are in control because they closed higher for the period.
ii. On the second candle, selling pressure stepped in and the price closed bearishly (more than 50% of the previous body), which tells you there is some selling pressure
Three Candlestick Pattern
As the name indicates, Such patterns are formed by three candles. Some very important Three candlestick patterns are
- Morning Star Pattern
- Three White Soldiers
- Evening Star Pattern
- Three Black Crows
Morning Star Patterns
This is a three-candle bullish reversal pattern that appears after a price decline. To identify it, look for these characteristics: the first candle closes bearishly, indicating selling pressure. The second candle has a small range, showing indecision. The third candle closes aggressively higher, covering more than 50% of the first candle’s body, signaling a strong shift in momentum from sellers to buyers.
Here’s what a morning star signifies:
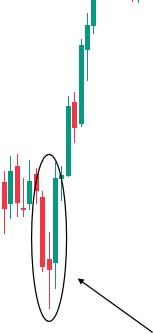
-In the first candle, sellers dominate, closing the price lower. However, in the first candle, sellers dominate, closing the price lower. In the third candle, buyers prevail, pushing the price higher.
-At the end, a morning star indicates that sellers are exhausted, and buyers are temporarily in control.
Three White Soldiers
Three White Soldiers is a three candle bullish reversal pattern that indicates end of the ongoing downtrend and start of an uptrend. This pattern shows that buyers are taking control and the price is expected to move higher.
How a Three White Soldiers looks like
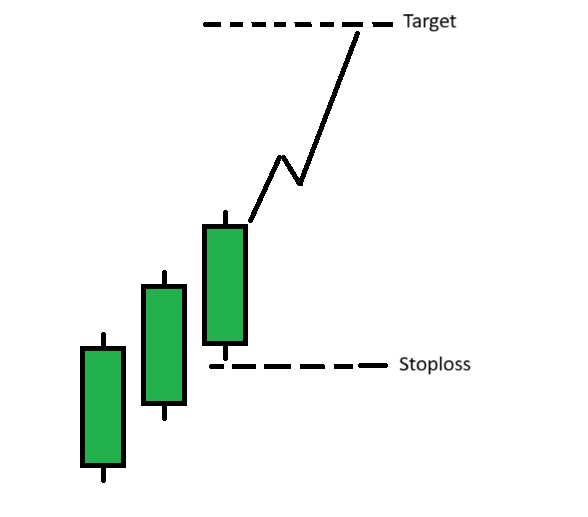
All the three candles of this pattern are long bullish candles such that open and close of each candle is above the open and close of the previous candle.
Another important feature of this pattern is that all three candles are of almost the same length and all three candles have comparatively smaller shadows.
How to Trade Three White soldiers
This candle indicate the strong bullish reversal and the momentum to be continued till some trading sessions.
The target price should be the 1:2 ratio of the candle, that means the target may set till 2 times tall than the last candle. And the stoploss will be below the close price of the third candle.
Evening Star Pattern
An evening star is a (three-candle) bearish reversal pattern that forms after an advance in price. Here’s how to recognize it:
• The first candle has a bullish close.
• The second candle has a small range.
• The third candle closes aggressively lower (more than 50% of the first candle)
And this is what an evening star means:
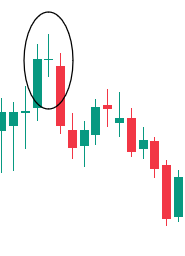
i. The first candle shows the buyers are in control as the price closes higher.
ii. on the second candle, there is indecision in the markets because both the selling and buying pressure are in equilibrium (that’s why the range of the candle is small).
iii. on the third candle, the sellers won the battle and the price closed lower. In short, an evening star tells you the buyers are exhausted, and the sellers are momentarily in control.
Three Black Crows Pattern
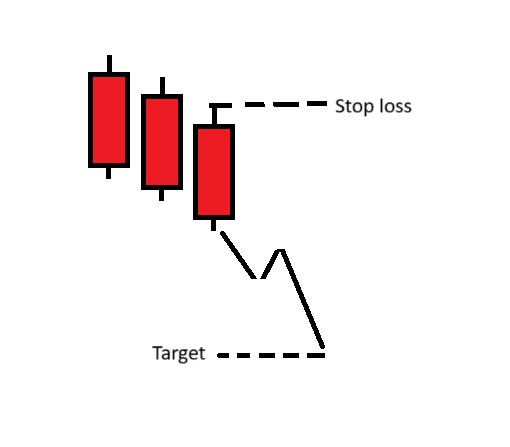
Three Black Crows is a three candle bearish reversal pattern that indicates end of the ongoing uptrend and start of a downtrend. Three Black Crows is a three candle bearish reversal pattern that indicates end of the ongoing uptrend and start of a downtrend. This pattern shows that sellers are taking control and price is expected to move lower.
All the three candles of this pattern are long bearish candles such that open and close of each candle is below the open and close of the previous candle.
Another important feature of this pattern is that all three candles are of almost the same length and all three candles have comparatively smaller shadows.
Important Notes:
Although candlestick patterns capture the attention of market players, they should never be traded upon in isolation. They should be used alongside other tools of technical analysis to confirm the overall trend.
For example, if you are focusing on the volume of the security for additional confirmation then if you get any trading signal using candlesticks pattern accompanied by rising volume then such a signal is considered to be a very strong trading signal.
Although as a Price Action Trader, we are not concerned with Technical Indicators, but it is still advised to look at Moving Average to get additional confirmation.
Another thing to remember is that there is no best or worst candlestick pattern. You have to figure out patterns that work for you and then stick to them.
If you are a beginner then I would request you to see more and more charts and try to identify candlestick patterns so that your eyes get trained to spot them easily.

