Here we will discuss about the Bullish Mat Hold Candlestick Pattern, how it forms, what it decides about future trend, and strategies to trade. Candlestick patterns are crucial technical tools for traders, providing insights into price action. These patterns, observed on candlestick charts over specific time frames, can indicate major trend reversals, brake outs, or continuations.
Bullish Mat Hold Candlestick Pattern : How it forms?
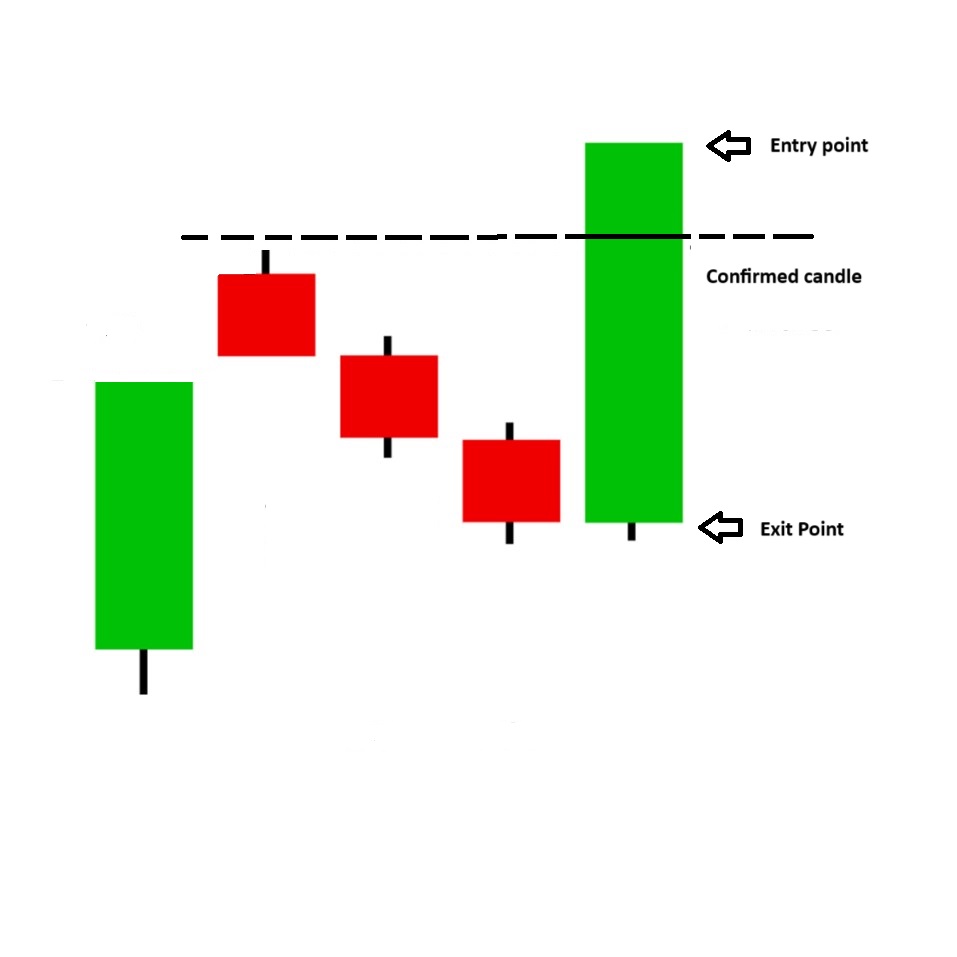
The Bullish Mat Hold candlestick pattern is very rarely formed in the chart, which signifies the continuation of an uptrend. Its a five candle charts pattern, where two tall and three short candles. The first candle is tall (bullish), followed by three small, bearish candles, and the fifth one is a large, bullish candle closes above the 1st candle.
What does it mean?
The first candle indicates bulls are dominant and making the candle green.
While second the candle is formed seller takes charge making three more small red candles. But the sellers are not able to stop the momentum of the bull run, it was just a pull backs.
After the red candles become weak, buyers again start entering and results a massive green candle. This turns the momentum upside and bull run resumes till few more green candles.
In short, this Bullish Mat Hold candlestick pattern signifies that the buyers have regained control after the slight pullback in the market

Bullish Mat Hold Candlestick Pattern : Psychology Behind
The Bullish Mat Hold candlestick pattern is a rarely observed that reflects the small profit booking of the bulls in an uptrend.
However, the first large green candle in the pattern in an uptrend suggests the strong buying pressure in the market. This is followed by a gap-up opening which further emphasizes the control of bulls in the market.
This is followed by three red candles that close above the low of the first green candle, showing that the bears couldn’t overpower the bulls. Next, a large green candle closes above the previous three red candles, indicating that the buyers have regained control and the uptrend is likely to continue.
Another important candlestick pattern is Hammer candlestick pattern which indicates a major turn around of market. Read the and download the Hammer candlestick pattern pdf.
Bullish Mat Hold Candlestick Pattern : How to Trade
This pattern appears when bullish trend is continuing, so, as a trader you should ensure that the previous trend is bullish.
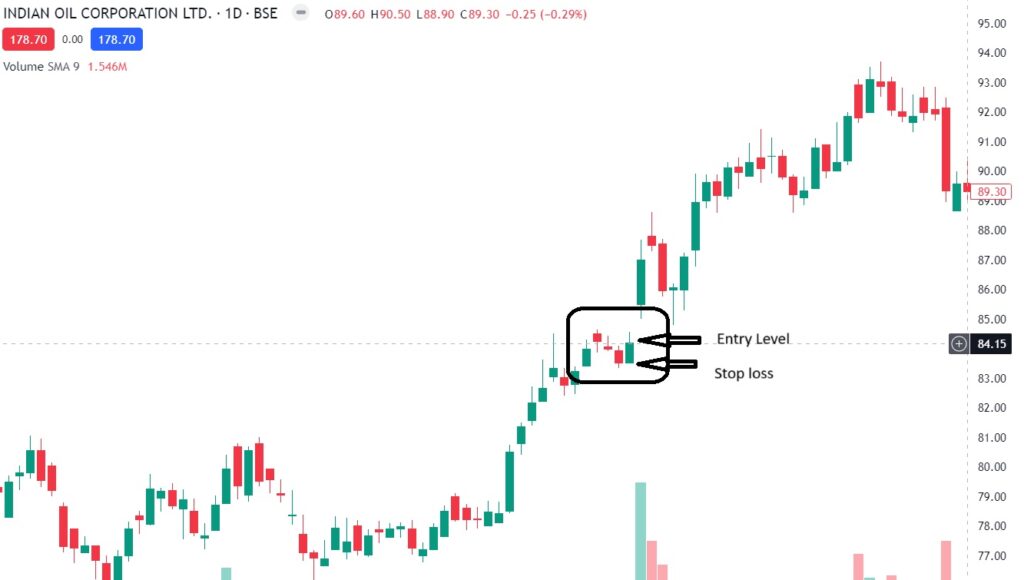
Here in the picture attached, you can see the formation of Bullish mat hold in a formed in Indian Oil Corporation Ltd chart.
Where to Entry- Once Bullish Mat Hold candlestick pattern forms, traders can take a long position at or just above the close price that is at Rs 84.15 of the final candle of the pattern.
Profit Target- Traders can exit the trade when the price of the security reaches near the immediate resistance zone. Once this level is reached, partial profits can be booked in the trade and the remaining position can be held until the next resistance level.
Stop loss- The stop-loss should be placed below the open price of the fifth candle that is Rs 83.10.

Trading Tips For Intraday Traders: When Bullish mat hold candlestick pattern formed within a 5 or 25 min time frame, start taking trade early before it touch the higher peak. Options traders should buy a Call of major quantity and hold it for next two three candles are formed. Otherwise, time beta decay may reduce your profits.
Day trading, a highest risk instrument but while you trade, focus on risk management and mind set of early profit booking.
As an Investor, one should be assure that the bull rally will continue after the Bullish mat hold formed. If want to entry then entry at given level and wait till a 1:2 or 1:3 ration profit booking.
For a investor the time frame may vary like Daily or Weekly time frame. So, based on the time frame your entry and exit will also change not like the day trader.
Conclusion
The bullish mat hold pattern bullish confirmatory pattern for traders or investor to detect a continuation of Bull run. Mastering the candlestick with its formation, meaning, and trading setup helps traders/Investors to make strong trading/investing decisions.
To become a master of stock trading you should be very careful about your risk appetite and well train with technical analysis. Here in this field we can help you for mastering different candlestick patterns that produces in stock chart.

