Bullish Reversal Candlestick Pattern pdf
Bullish reversal candlestick pattern pdf describes that buyers have temporarily taken control. However, it’s important not to buy immediately upon spotting such a pattern, as market conditions must also be considered (more on that later).
For now, let’s discuss five bullish reversal candlestick patterns:
1-Hammer Candlestick Pattern
2-Bullish Engulfing pattern.
3-Piercing Candlestick pattern
4-Tweezer bottom candlestick pattern
5-Morning star candlestick pattern
There are numerous bullish reversal candlestick patterns, but you don’t need to learn them all. The main goal is to understand how to read these patterns, rather than memorizing each one. So, let’s dive in and get started.
1-Hammer Candlestick Pattern
A hammer is a single-candle bullish reversal pattern that appears after a price decline. Here’s how to identify it:
Little or no upper shadow.
The price closes in the top quarter of the range.
The lower shadow is about two to three times the length of the body.
The lower shadow is about two to three times the length of the body.
And this is what a hammer means:
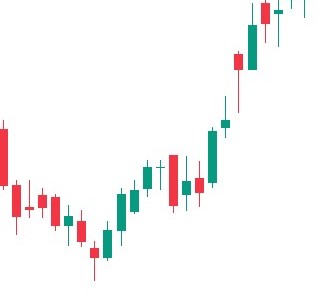
-When the market opened, the sellers took control and pushed the price lower.
-At the selling climax, huge buying pressure stepped in which pushed the price higher.
-The buying pressure was so strong that it closed above the opening price.
In short, a hammer is a bullish reversal candlestick pattern that shows rejection of lower prices.
2-Bullish Engulfing Pattern
A bullish engulfing pattern is a two-candle bullish reversal pattern that appears after a price decline. To identify it, look for the following characteristics:
The first candle closes bearishly, indicating continued selling pressure.
The second candle opens lower but then closes higher, completely covering the body of the first candle without considering the shadows.
This second candle closes bullish, signaling a strong shift in momentum from sellers to buyers.
So current pattern suggests that buyers have taken control, potentially leading to a price increase.
And this is what a bullish engulfing pattern means:
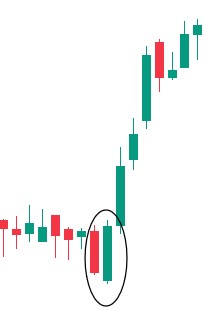
-In the first candle, sellers dominate, closing the price lower for the period. However, in the second candle, strong buying pressure emerges, closing above the previous candle’s high, indicating that buyers have taken control.
-At the end , a bullish engulfing pattern signifies that buyers have overpowered sellers and are now in control.
3-Piercing Candlestick pattern: Important Bullish Reversal Candlestick pattern pdf
A piercing pattern is a two-candle reversal pattern that appears after a price decline. Unlike the bullish engulfing pattern, which closes above the previous candle’s open, the piercing pattern closes within the body of the previous candle, making it slightly less strong in terms of reversal signal.
Here’s how to identify a piercing pattern:
The first candle closes bearishly, indicating continued selling pressure. where as the second candle opens lower, but strong buying pressure pushes the price up, closing beyond the halfway mark of the first candle’s body.
In essence, a piercing pattern suggests that buyers are starting to gain control, but the signal is not as strong as a bullish engulfing pattern.

On the first candle, the sellers are in control because they closed lower for the period.
Next, on the second candle, buying pressure has stepped in. and the close was bullish (more than half of the previous candle), which suggests you there is buying pressure present.
If you have a reached here like only 1% of the readers then also master the Doji Candlestick pattern with pdf attached.
4-Tweezer Bottom Candlestick pattern
When I mention “tweezer,” Its not referring to the tool for plucking nose hairs (though it does resemble one). Instead, a tweezer bottom is a two-candle reversal pattern that appears after a price decline.
Here’s how to identify it:
The first candle indicates a rejection of lower prices, while the second candle re-tests the low of the previous candle and closes higher.
Here’s what a tweezer bottom signifies:

-In the first candle, sellers drive the price lower but encounter some buying pressure. But, the second candle signifies, the sellers attempt to push the price lower again but fail, ultimately being overwhelmed by strong buying pressure.
-This pattern indicates a potential reversal, suggesting that buyers are starting to take control after a period of selling pressure.
5-Morning star candlestick pattern
A morning star is a three-candle bullish reversal pattern that appears after a price decline. To identify it, look for these characteristics: the first candle closes bearishly, indicating selling pressure. The second candle has a small range, showing indecision. The third candle closes aggressively higher, covering more than 50% of the first candle’s body, signaling a strong shift in momentum from sellers to buyers.
Here’s what a morning star signifies:
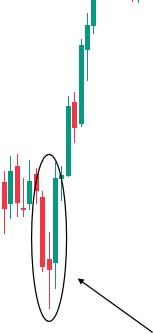
-In the first candle, sellers dominate, closing the price lower. However, in the first candle, sellers dominate, closing the price lower. In the third candle, buyers prevail, pushing the price higher.
-In essence, a morning star indicates that sellers are exhausted, and buyers are temporarily in control.
Like wise Bullish Reversal patterns you should also understand the Five important Bearish Candlestick patterns for candlestick mastery.
6-Bullish Harami Candlestick Pattern:
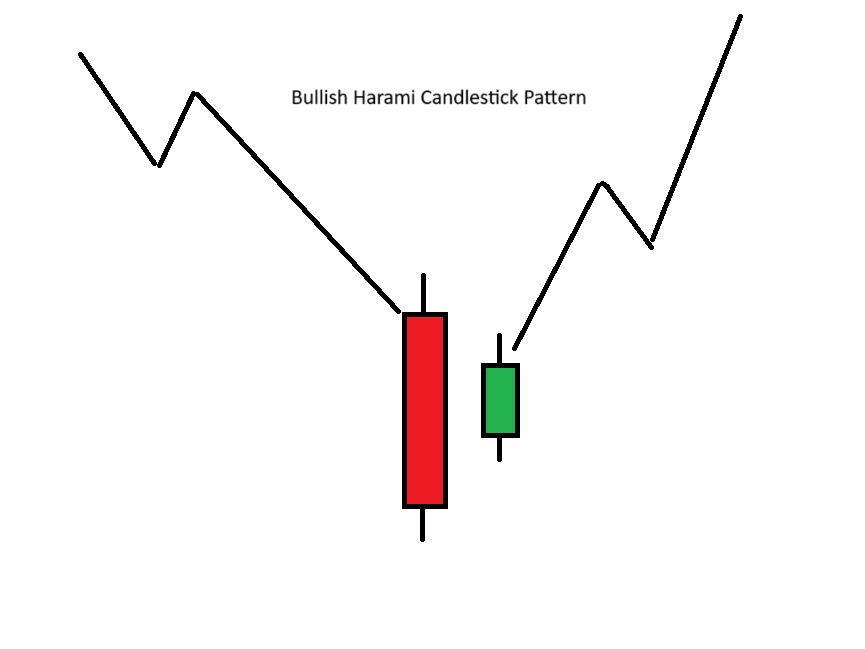
Bullish Harami is a two candle bullish reversal pattern that indicates end of the ongoing downtrend and start of an uptrend.
Pattern derives its name from the Japanese word Harami which means a “Pregnant Woman” because the graphic that represents this pattern resembles a pregnant woman.
In this pattern, the first day is generally a large red or black bearish candle that forms in line with the ongoing bearish trend, followed by a small green or white bullish candle having a small body and comparatively smaller lower and upper shadows.
The body of the second candle is contained within the body of the previous candle.
Ideally, the size of the body of the larger candle should be approximately 4 times the size of the body of the smaller candle.
The pattern works better if the upper and lower shadow of white or green candle doesn’t go beyond the black or red candle.
This pattern suggests that buyers are taking control and ready to take the price higher.
How a Bullish Harami Chart Pattern looks:
7-Three White Soldiers Pattern:
Three White Soldiers is a three candle bullish reversal pattern that indicates end of the ongoing downtrend and start of an uptrend. This pattern shows that buyers are taking control and the price is expected to move higher.
How a Three White Soldiers looks like
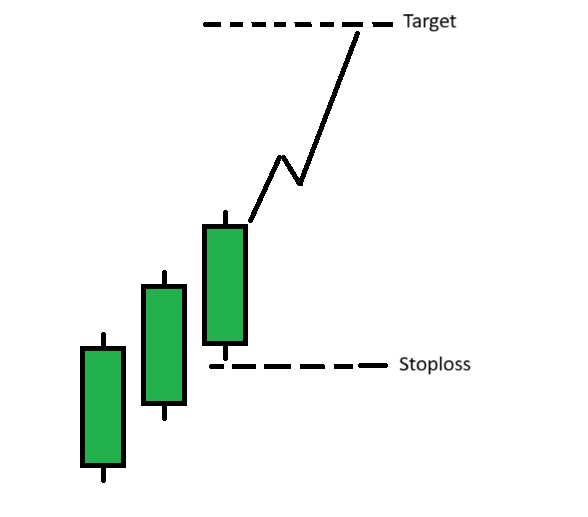
All the three candles of this pattern are long bullish candles such that open and close of each candle is above the open and close of the previous candle.
Another important feature of this pattern is that all three candles are of almost the same length and all three candles have comparatively smaller shadows.
How to Trade Three White soldiers
This candle indicate the strong bullish reversal and the momentum to be continued till some trading sessions.
The target price should be the 1:2 ratio of the candle, that means the target may set till 2 times tall than the last candle. And the stoploss will be below the close price of the third candle.
Conclusion:
There are 7 important bullish Reversal Candlestick pattern which signifies a Upside trend reversal .

Pingback: Morning star & Evening Star candlestick Pattern. How to Trade? - stockmarketpatterns.com
Pingback: All Candlestick Chart Patterns pdf - stockmarketpatterns.com
Pingback: 6 Important Reversal Chart patterns - stockmarketpatterns.com