In the Price Action analysis understanding Chart pattern is a skill. In this article Bearish Candlestick patterns pdf: 5 important patterns we will understand How to trade or behave when market goes bearish.
Bearish Chart patterns are a group of candlestick pattern which indicates bearish trend reversal.
If you are a day trader then this candlestick patterns pdf will guide you to become an expert.
Lets understand what is a Bearish chart pattern?
Bearish reversal candlestick patterns indicates that sellers are in control now. However, this doesn’t mean you should sell immediately when you spot such kind of pattern because you should consider the market conditions (more explanation explained below).
For now, these are the important five bearish reversal candlestick patterns that we will be discussing here.
Bearish Candlestick Patterns Pdf: 5 important patterns Details analysis
1- Shooting star Candlestick pattern
2- Bearish Engulfing pattern
3- Dark cloud cover pattern
4- Tweezer top candlestick pattern
5- Evening star candlestick pattern
Let’s deep dive into the details…
Download pdf copy of Bearish Candlestick patterns
1. Shooting Star candlestick pattern
A shooting star is a single candle bearish reversal pattern that forms after a surge in price. Here’s how to recognize it:
• There is little or no lower shadow.
• The price closes at the bottom quarter of the range.
• The upper shadow is about two or three times the length of the body
Here in the picture you can see what a shooting star means:
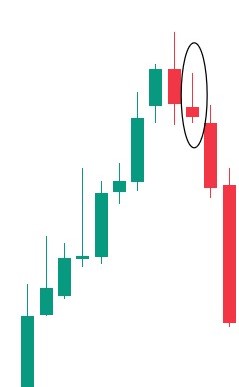
a. When the market opened, the buyers took control and surged the price higher.
b. During Buying period, sellers entered massively and huge selling pressure stepped in and pushed the price lower.
c. The selling pressure was so strong that it closed below the opening price.
In Conclusion, a shooting star is a bearish reversal candlestick pattern that shows rejection of higher prices.
What next then?
What will be the next candle and trend after shooting star is formed?
Here is your answer..
After a shooting star, sellers are in control and next candle will be a bearish trend so, you should start selling your holding. Or else if you are a trader then start buying PUT options.
How to trade with Shooting star candlestick pattern? This is for another article.
2. Bearish Engulfing candlestick pattern
A bearish engulfing pattern is a (two-candle) bearish reversal pattern that forms after an advance in price. Here’s how to recognize it:
• The first candle has a bullish close.
• The body of the second candle completely “covers” the body first candle (without taking into consideration the shadow).
• The second candle closes bearish
And this is what a bearish engulfing pattern means:
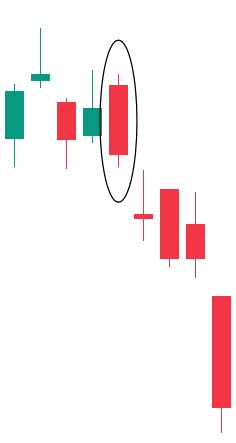
1. On the first candle, the buyers were in control since they closed higher for the period.
2. On the second candle, strong selling pressure stepped in and the price closed below the previous candle’s low, which tells you that the sellers have won the battle for now. In essence, a bearish engulfing pattern tells you the sellers have overwhelmed the buyers and are now in control.
3. Dark Cloud Cover Candlestick pattern
A dark cloud cover is a two-candle reversal pattern that forms after a surge in price. Unlike the bearish engulfing pattern that closes below the previous open, the dark cloud cover closes within the body of the previous candle. Thus, in terms of strength, dark cloud cover isn’t as strong as the bearish engulfing pattern.
Here’s how to recognize it:
• The first candle has a bullish close.
Bearish Engulfing Pattern, How to Master Candlestick Patterns Like a Pro?
• The body of the second candle closes beyond the halfway (More than 50%) mark of the first candle.
And this is what a dark cloud cover means:
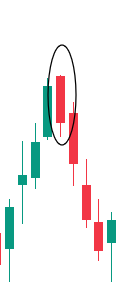
1. On the first candle, the buyers are in control because they closed higher for the period.
2. On the second candle, selling pressure stepped in and the price closed bearishly (more than 50% of the previous body), which tells you there is some selling pressure.
Like this candlestick patterns, read important Hammer candlestick pattern pdf to catch bullish candle from the bottom.
4. Tweezer Top Candlestick Pattern
A tweezer top is a two-candle reversal pattern that occurs after an advance in price.
Here is how to recognize it:
•The first candle shows rejection of higher prices.
•The second candle re-tests the high of the previous candle and closes lower.
And this is what a tweezer top means:
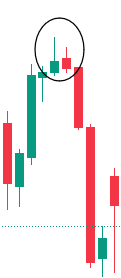
- On the first candle, the buyers pushed the price higher and were met with some selling pressure.
- On the second candle, the buyers again tried to push the price higher but failed and were finally overwhelmed by strong selling pressure. In short, a tweezer top tells you the market has difficulty trading higher (after two attempts) and it’s likely to head lower.
5. Evening Star Candlestick pattern
An evening star is a (three-candle) bearish reversal pattern that forms after an advance in price. Here’s how to recognize it:
• The first candle has a bullish close.
• The second candle has a small range.
• The third candle closes aggressively lower (more than 50% of the first candle)
And this is what an evening star means:
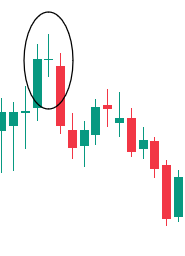
1. The first candle shows the buyers are in control as the price closes higher.
2. on the second candle, there is indecision in the markets because both the selling and buying pressure are in equilibrium (that’s why the range of the candle is small).
3. on the third candle, the sellers won the battle and the price closed lower. In short, an evening star tells you the buyers are exhausted, and the sellers are momentarily in control.
Understand all candlestick patterns pdf to master the price action analysis.
People Also ask (FAQs)
What are the major Bearish candlestick pattern?
Ans: The major Five patterns are: Shooting star pattern, Bullish engulfing pattern, Tweezer pattern, Evening star pattern and Dark cloud cover pattern.
Shooting star is a which type of Candlestick pattern?
Shooting star is a bearish reversal candlestick pattern. From here trend may move to downside.
Dark Cloud Cover Candlestick pattern is a which kind of candlestick?
Ans: Its Bearish candlestick reversal pattern. From the close price, share price falls down.

Pingback: Bullish reversal Candlestick pattern pdf | 5 Imp. patterns
Pingback: Morning star & Evening Star candlestick Pattern. How to Trade? - stockmarketpatterns.com
Pingback: Market Stages in Price Action Trading - stockmarketpatterns.com
Pingback: 6 Important Reversal Chart patterns - stockmarketpatterns.com