In the world of Investing and Trading, you have to understand 6 Important Continuation Chart Patterns those will guide to catch the Top and Bottom of the stock market. Here in this article you will able to understand the basics of all continuation chart pattern which will help you to place your order and entry with higher accuracy.
Table of Contents
1-Ascending Triangle Chart Pattern:
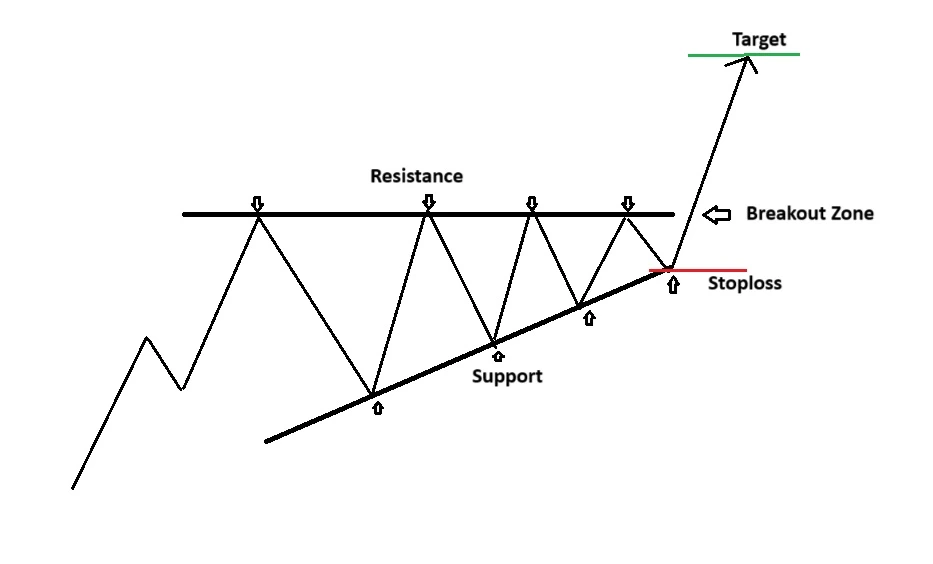
It is a bullish continuation pattern that occurs in an uptrend and signals that the price of the Stock will continue to trend higher on completion of the pattern.
This pattern shows that buyers are getting very aggressive and are likely to take prices even higher once the price breaks through the pattern.
As seen in the chart on the previous page, this pattern is formed between a rising lower trend line (Support Line) and a flat horizontal trend line (Resistance Line). This shows a continuation in the prevailing trend and indicates that buyers are more aggressive continues to make higher lows than sellers as the price.
The candlestick chart pattern is said to be complete only when a breakout happens on the continuation side, i.e., price breaks the resistance. This is when; a long entry is taken in the Stock.
It is a very powerful continuation chart pattern so if a trader has missed the uptrend earlier then he can use this opportunity to enter the Stock after a breakout on the higher side.
The potential target for the pattern is normally calculated by projecting the height of the ascending triangle at its thickest point above the breakout point.
In case of this pattern, the stop loss will be placed at the swing low which occurs just before the price breaks the resistance on the upside as shown in the figure on the previous page. This will give us a favorable risk to reward ratio.
The pattern is considered to be more reliable if you notice high volumes during the uptrend followed by flat or low volumes during the consolidation period when the price is in the triangle and again increased volume when a breakout occurs.
Download all candlestick chart patterns pdf here
2-Descending Triangle Chart Pattern
It is a bearish continuation pattern that occurs in a downtrend and signals that the price of the Stock will continue to trend lower on completion of the pattern.
This pattern shows that sellers are getting very aggressive and are likely to take prices even lower once the price breaks through the pattern.
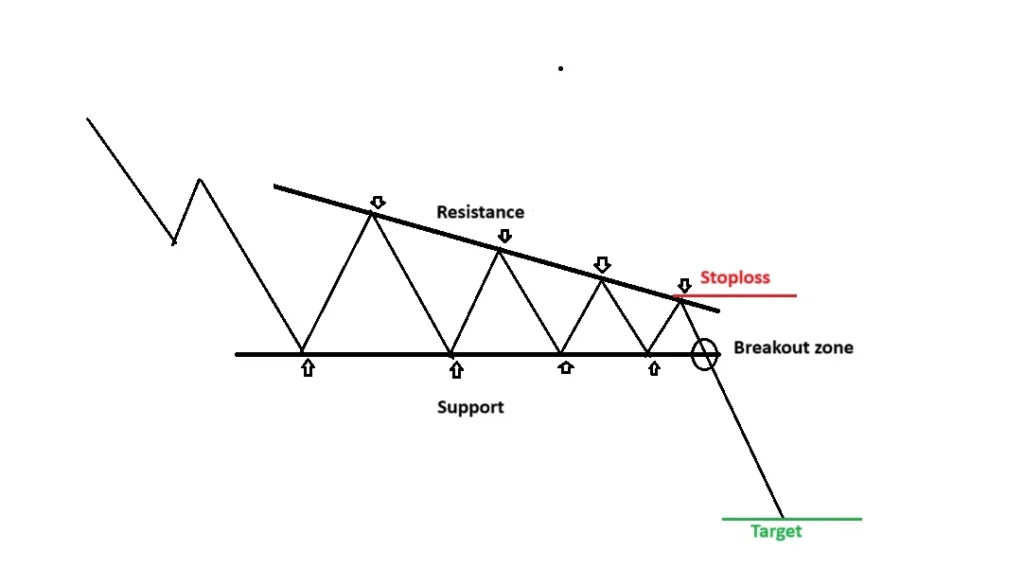
As seen in the chart above, this Descending Triangle chart pattern is formed between a falling upper trend line (Resistance Line) and a flat horizontal trend line (Support Line). This shows a continuation in the prevailing trend and indicates that sellers are more aggressive than buyers as the price continues to make lower highs.
The pattern is said to be complete only when a breakout happens on the continuation side i.e., price breaks the support. This is when; a short entry is taken in the Stock
The potential target for the pattern is normally calculated by projecting the height of the descending triangle at its thickest point below the breakout point.
In case of this pattern, the stop loss will be placed at the swing high which occurs just before the price breaks the support on the downside as shown in the figure on the previous page.
The pattern is considered to be more reliable if you notice high volumes during the downtrend followed by flat or low volumes during the consolidation period when the price is in the triangle and again increased volume when a breakout occurs.
You can also read Different Market stages in Price Action Trading
3-Bullish Rectangle Chart Pattern
It is a bullish continuation pattern that occurs in an uptrend and signals that the price of the Stock will continue to trend higher on completion of the pattern.
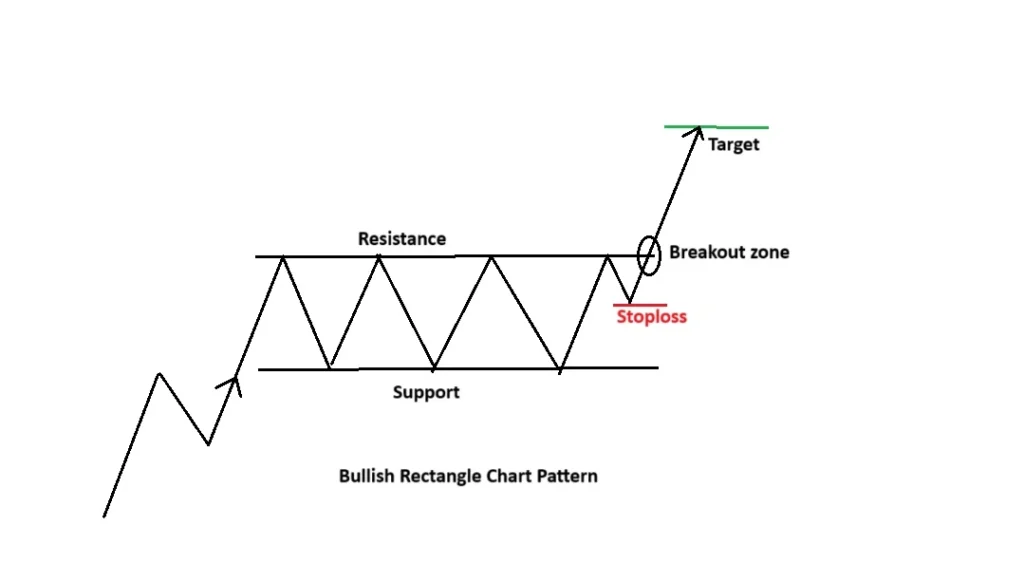
This pattern shows that a tug of war was going on between the buyers and sellers and eventually the buyers managed to win after price gave a breakout on upside. Subsequently, buyers get aggressive and take the price even higher.
As seen in the chart on the previous page, this pattern is formed between a flat upper trend line (Resistance Line) and a flat lower trend line (Support Line).
The pattern is said to be complete only when a breakout happens on the continuation side, i.e., price breaks the resistance. This is when; a long entry is taken in the Stock.
It is a very powerful continuation chart pattern so if a trader has missed the uptrend earlier then he can use this opportunity to enter the Stock after a breakout on the higher side.
The potential target for the pattern is normally calculated projecting the height of the rectangle i.e., height between the two flat trend lines above the breakout point.
In case of this pattern, the stop loss will be placed at the swing low which occurs just before the price breaks the resistance on the upside as shown in the figure on the previous page.
The pattern is considered to be more reliable if you notice high volumes during the uptrend followed by flat or low volumes during the consolidation period when the price is within the rectangle and further increase volume when a breakout occur.
Download HAMMER Candlestick chart pattern pdf and master yourself how to buy from Bottom
4-Bearish Rectangle Chart Pattern
It is a bearish continuation pattern that occurs in a downtrend and signals that the price of the Stock will continue to trend lower on completion of the pattern.
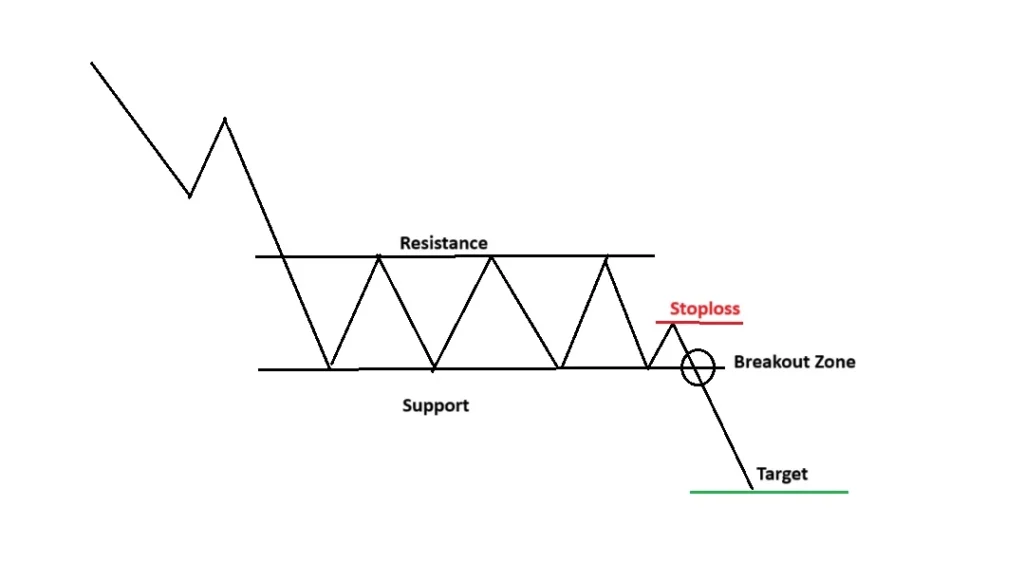
This pattern shows that a hustle happening between the sellers and buyers and after period of time the sellers managed to win after price gave a breakout on downside. Later on, sellers got aggressive and took the price even lower.
As seen in the chart above, this pattern is formed between a flat upper trend line (Resistance Line) and a flat lower trend line (Support Line).
The pattern is said to be complete only when a breakout happens on the continuation side, i.e., price breaks the support. This is when; a short entry is taken in the Stock.
The potential target for the pattern is normally calculated projecting the height of the rectangle i.e., height between the two flat trend lines below the breakout point.
In case of this pattern, the stop loss will be placed at the swing high which occurs just before the price breaks the support on the downside as shown in the figure above.
The pattern is considered to be more reliable if you notice high volumes during the downtrend followed by flat or low volumes during the consolidation period when the price is within the rectangle and further increase volume when a breakout occurs.
Download 6 Important Continuation Chart Patterns pdf here
5-Cup and Handle Chart Pattern
It is a bullish continuation pattern that occurs in an uptrend and signals that the price of the Stock will continue to trend higher on completion of the pattern.
The pattern is named before its shape, which looking like a tea cup with a handle.
It is one of the most occurring patterns used across the world to spot dominant uptrend for taking long positions.
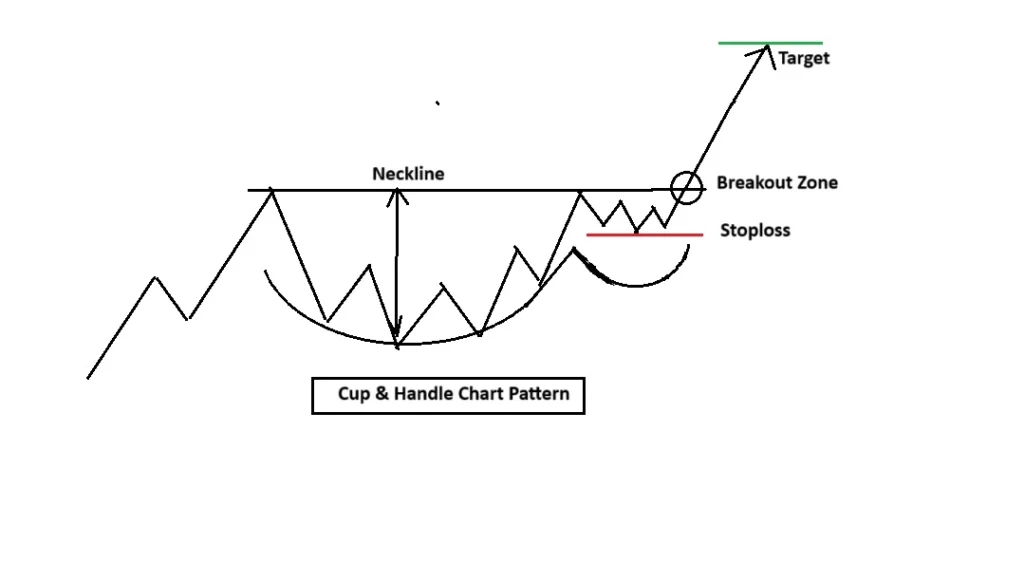
This pattern is characterized by a cup or a bowl shape which acts as a base for the pattern representing a period of consolidation followed by a handle that is bending on lower side representing a short pullback. A horizontal line drawn at the top of the cup is known as the neckline.
The pattern is said to be complete only when the price breaks the neckline on the upside, after formation of a handle. This is when a long entry is taken in the Stocks.
It is a very powerful continuation chart pattern so if a trader has missed the uptrend earlier then he can use this opportunity to enter the Stock after a breakout on the higher side.
The potential target for the pattern is normally calculated projecting the height of the cup i.e., height between the neckline and bottom of the cup above the breakout point.
In case of this pattern, the stop loss is placed at the lowest point of the handle of the pattern as shown in the figure above.
The pattern is considered to be more reliable if there is a significant rise in volume when the price breaks above the neckline.
6-Inverted Cup and Handle Chart Pattern
As the name indicates, it is an inverted version of the Cup and Handle Pattern explained above.
It is a bearish continuation pattern that occurs in a downtrend and signals that the price of the Stock will continue to trend lower on completion of the pattern.
It is one of the most occurring patterns used across the world to spot dominant downtrend for taking short positions.
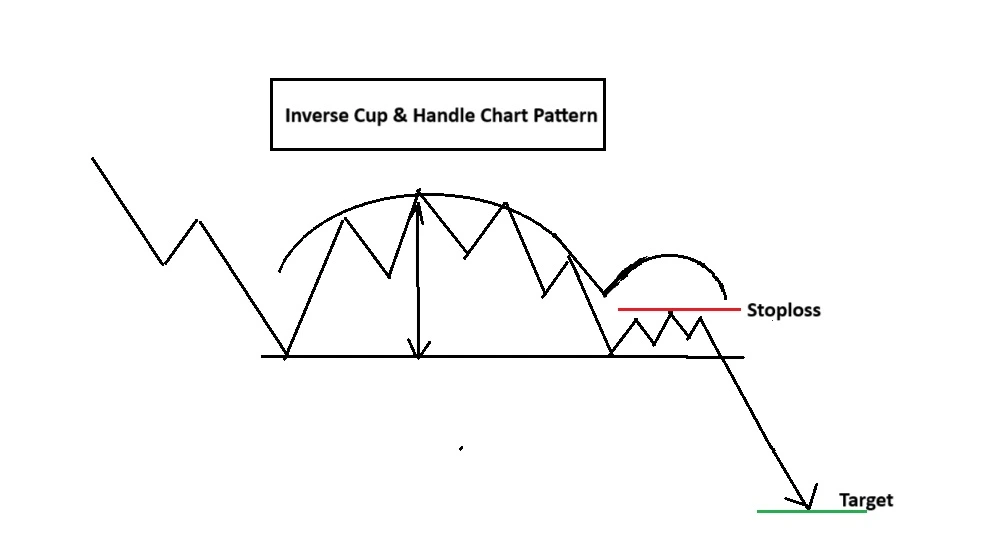
This pattern is characterized by an inverted cup or a bowl shape which acts as a top for the pattern representing a period of consolidation followed by a handle that is bending higher side representing a short pullback.
A horizontal line drawn at the bottom of the inverted cup is known as the neckline.
The pattern is said to be complete only when the price breaks the neckline on the downside, after formation of a handle. This is when a short entry is taken in the Stock.
The potential target for the pattern is normally calculated projecting the height of the cup i.e., height between the neckline and top of the inverted cup below the breakout point.
In case of this pattern, the stop loss is placed at the highest point of the handle of the pattern as shown in the figure above.
The pattern is considered to be more reliable if there is a significant rise in volume when the price breaks below the neckline.
Frequently Asked Questions:
What are the 3 most important Bearish continuation chart patterns?
1-Descending Triangle chart pattern
2-Bearish Rectangle Chart Pattern
3-Inverted Cup and Handle chart pattern
What are the 3 most important Bullish continuation chart patterns?
1-Ascending Triangle chart pattern
2-Bullish Rectangle Chart Pattern
3-Cup and Handle chart pattern
What is the risk to reward ration of Ascending Triangle chart pattern?
For an investor Ascending Triangle chart pattern has 1:3 risk to ratio similarly for Trader Risk:Reward ration will be 1:2.


Pingback: 5 Important Neutral Chart Patterns - stockmarketpatterns.com